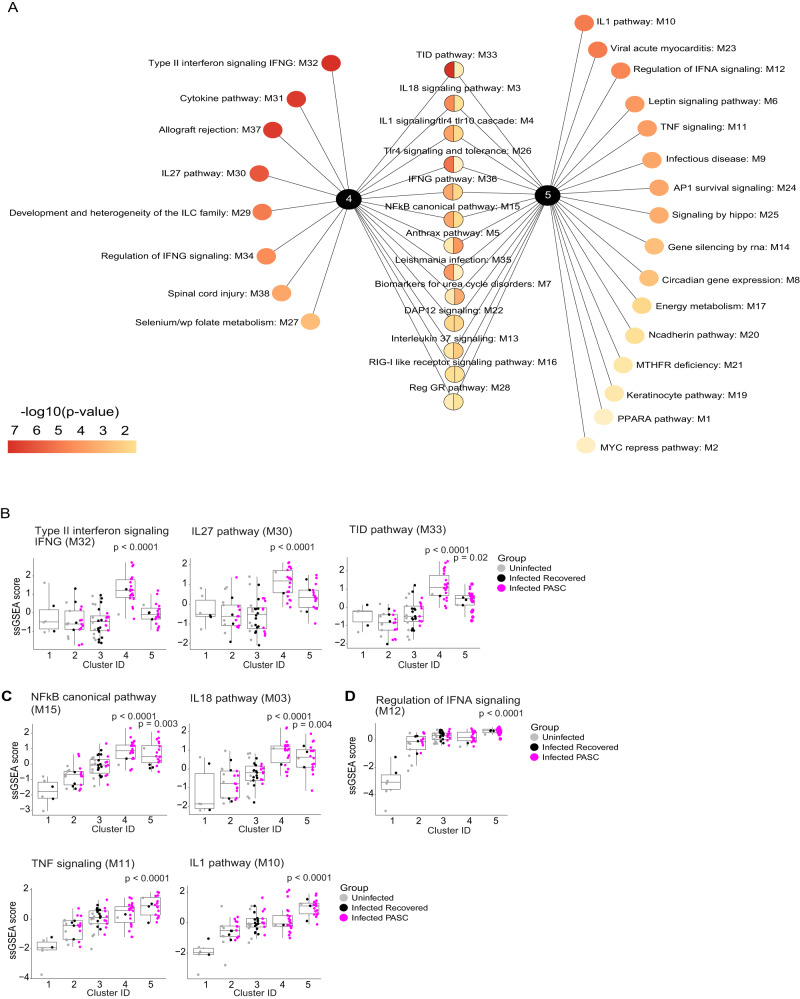
Fig. 2. Key pathway modules driving inflammatory PASC signatures.
A Modules that are significantly expressed more highly in clusters 4 and 5 relative to all other clusters. Modules unique to a cluster are arranged and ranked by increasing adjusted p-value of <0.05, while modules expressed in both clusters are arranged and ranked by the average of their adjusted p-values. The color gradient of each node represents the -log10 adjusted p-value. P-values were determined by a two-sided Wilcoxon test. B–D Box and jitter plots of the Single Sample Gene Set Enrichment Analysis (ssGSEA) scores (y-axis) across all clusters (x-axis) (that consist of PASC, n = 55; recovered, n = 24; uninfected, n = 22 participants) for the top-ranked modules that were enriched in inflammatory clusters 4 and 5. P-values determined by a two-sided Wilcoxon test were calculated comparing inflammatory cluster 4 and inflammatory cluster 5 independently to clusters 1,2,3. Box plots show the median (centerline), the first and third quartiles (the lower and upper bound of the box) and the whiskers show the 1.5x interquartile range of the data.

