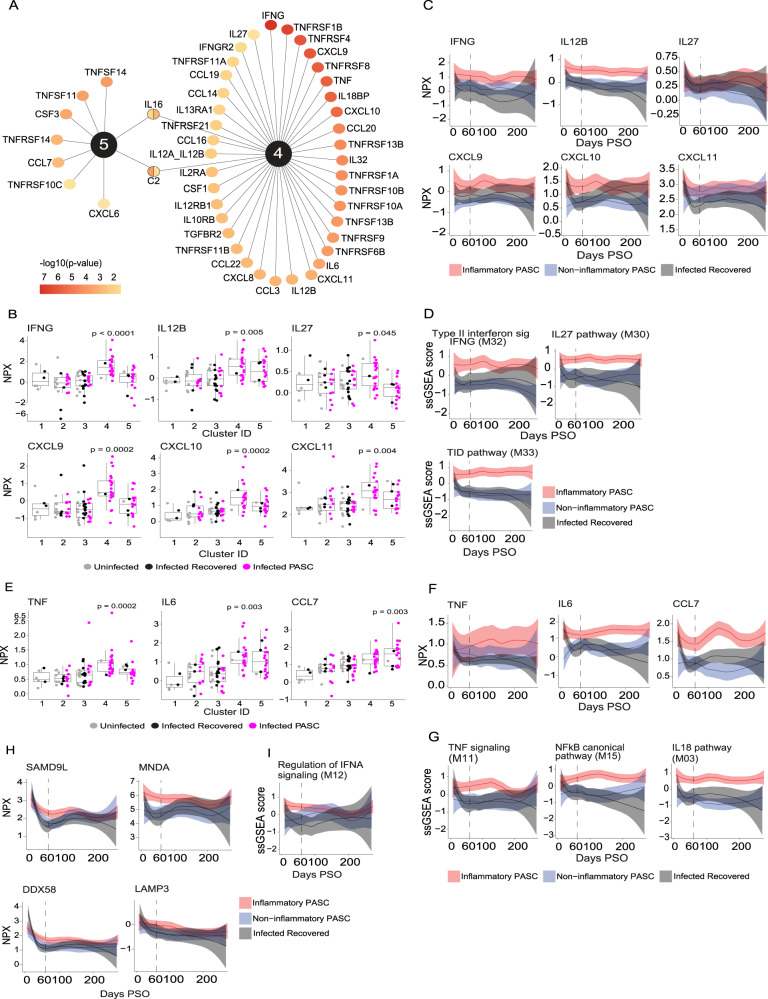
Fig. 3. Longitudinal assessment of key cytokines and chemokines driving inflammatory PASC signatures.
A Differentially expressed cytokines, chemokines, and their receptors up-regulated in inflammatory clusters 4 & 5. Proteins significantly up-regulated in clusters 4 and 5 relative to all other clusters are reported. P-values were tested by a two-sided Wilcoxon test and adjusted for multiple comparisons. The color gradient of nodes represents the -log10 adjusted p-value. B Box plots of IFN-γ Normalized Protein Expression (NPX) (y-axis) and its related cytokines and chemokines across clusters (x-axis) in 55 PASC, 24 recovered, 22 uninfected participants which were significantly upregulated exclusively in cluster 4. P-values were calculated comparing inflammatory clusters 4 and 5 independently to clusters 1,2,3, using a two-sided Wilcoxon test. C Longitudinal Loess fit plots of IFN-γ NPX (y-axis) and its related cytokines and chemokines on samples available from early acute infection through >250 days post symptom onset (PSO) (x-axis). PASC participants from inflammatory clusters 4 and 5 are represented as inflammatory PASC (red), PASC participants from clusters 2 and 3 as non-inflammatory PASC (blue) while the recovered participants are in black. D Longitudinal Loess fit plots of the Single Sample Gene Set Enrichment Analysis (ssGSEA) scores (y-axis) of IFN-γ related modules over time (x-axis). E Box plots of TNF, IL6 and CCL7 NPX (y-axis) across clusters (x-axis) in 55 PASC, 24 recovered, 22 uninfected participants which were significantly upregulated in clusters 4 and 5. P-values were calculated comparing clusters 4 and 5 independently to clusters 1,2,3, using a two-sided Wilcoxon test. All box plots show the median (centerline), the first and third quartiles (the lower and upper bound of the box) and the whiskers show the 1.5x interquartile range of the data. F Longitudinal Loess fit plots of TNF, IL6 and CCL7 NPX (y-axis) over time (x-axis). G Longitudinal Loess fit plots of the ssGSEA scores (y-axis) of TNF and NF-κB related signaling modules over time (x-axis). H, I Longitudinal Loess fit plots of NPX and ssGSEA scores (y-axes) of type-I IFN-driven proteins and the IFN-α module over time (x-axis) respectively. The bands in all loess smooth fit plots display the 95% confidence interval.

