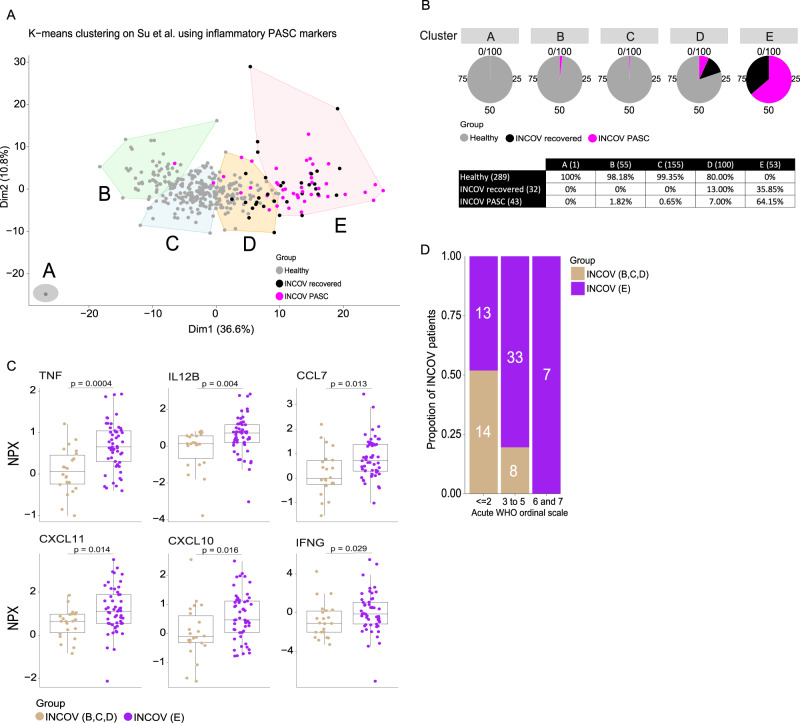
Fig. 5. Independent cohort validation of inflammatory PASC signatures.
A K-means unsupervised clustering of Olink proteomic data from Su Y et al. (2022) showing 5 clusters, A–E of INCOV participants that consisted of PASC (symptomatic) and recovered (participants showing no PASC symptoms) along with healthy controls. B Pie chart representation and table showing the percentage of PASC, recovered and healthy participants within each cluster. The number of participants per cluster (columns) and per group (rows) are represented within brackets. C Box and jitter plots of cytokines/chemokines significantly upregulated in the INCOV participants of cluster E (n = 53) vs. INCOV participants of clusters B, C, and D (n = 22). P-values were determined by a two-sided Wilcoxon test. Box plots show the median (centerline), the first and third quartiles (the lower and upper bound of the box) and the whiskers show the 1.5x interquartile range of the data. D Distribution of different disease severities, as judged by World Health Organization (WHO) ordinal scale across INCOV participants in cluster E vs INCOV participants in clusters B, C, and D. Y-axis and the numbers in bar graphs represent proportion and number of participants per INCOV group in each WHO scale bin respectively.

