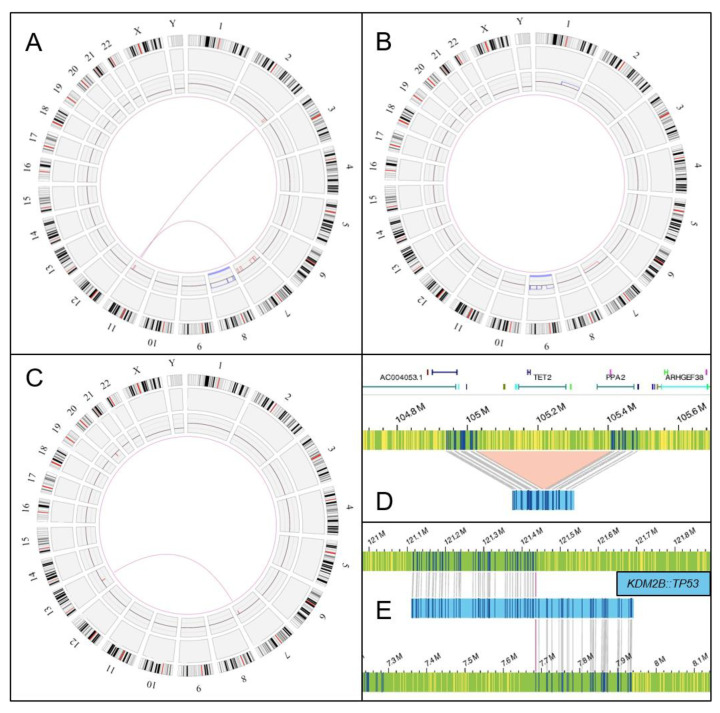
Figure 1.
Optical genome mapping selected cases: circos plot and SV analysis. (A) Circos plot showing a complex event with t(2;11)(q37.1;q23.2) and t(7;11)(q31.31;q24.1) and with material losses in adjacent regions with a trisomy of chromosome 8 (patient #10); (B) gain of material in region 1q21.1q44, loss of material in region 7q11.21q36.3, and trisomy of chromosome 9 (patient #5); (C) translocation t(7;13)(q34;q14.2) with material losses in adjacent regions and deletion of 20q11.21q11.22 (patient #11); (D) deletion in region 4q24 involving a homozygous deletion of TET2 (patient #6); (E) KDM2B::TP53 gene fusion resulting from t(12;17)(q24.31;p13.1) (patient #4).

