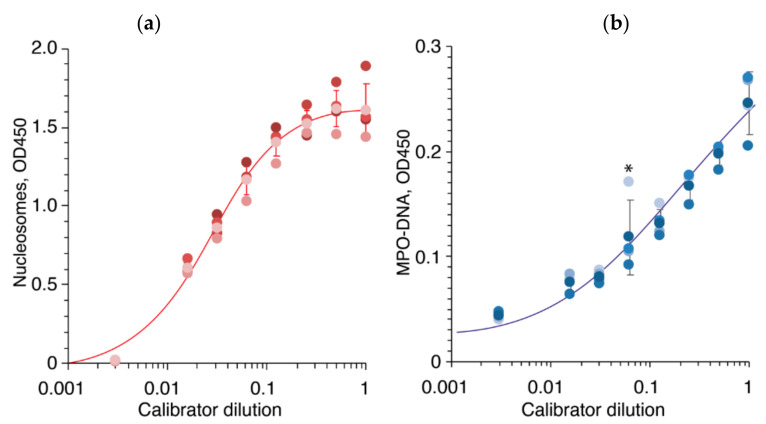
Figure 10.
ELISA calibration curves of the nucleosomes (a) and MPO-DNA (b) are shown by red and blue lines, respectively. Serial dilutions of the DNA-Histone-Complex standard (Roche, Cell Death Detection ELISA PLUS) were used as a positive control (1:2, 1:4, 1:8, 1:16, 1:32, 1:64, 1:128, 1:333) on each 96-well plate. Individual values from each plate (n = 4), as well as average and standard deviation, are shown by dots and bars, respectively. Asterisk denotes outlier value.

