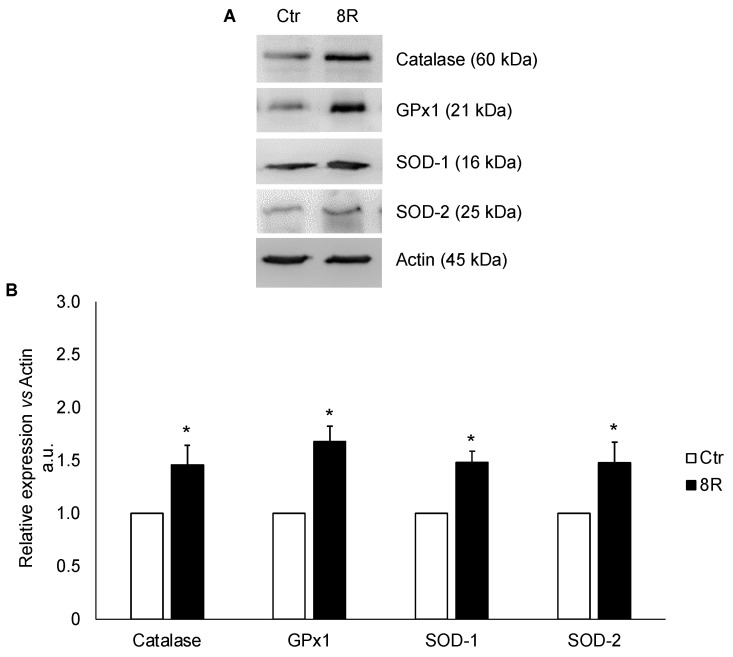
Figure 1.
Antioxidant enzymes in oviducts collected from unstimulated (Ctr) and hyperstimulated (8R) mice. Representative Western blot images of catalase, GPx1, SOD-1 and -2 (A). Values are expressed as arbitrary units (a.u.), considering the Ctr values arbitrarily as 1. Bar graph data represent the mean ± SD after normalization of each protein with the respective actin used as a loading control for three independent determinations (B). * p < 0.05 vs. Ctr.

