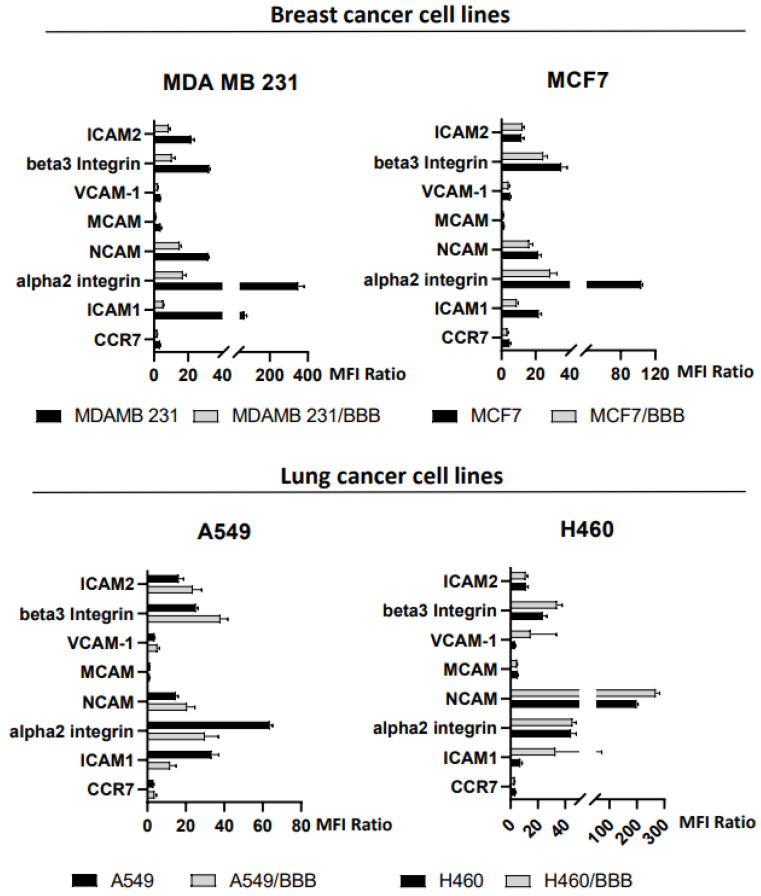
Figure 2.
Expression of adhesion molecules in breast (upper panel) and lung (lower panel) human cancer cell lines as detected by flow cytometry, in original cell lines and their migrated subpopulation expanded in vitro (cell line/BBB, see M&M). A significant decrease in alpha2 integrin and ICAM1 expression was detected in transmigrated cells in three out of four cell lines. Data are expressed as the ratio of mean fluorescence intensity (MFI) of specific antibody and isotype control. Values higher than 1 indicate the expression of the molecule. Data refer to at least three independent experiments (see also Figures S3 and S4).

