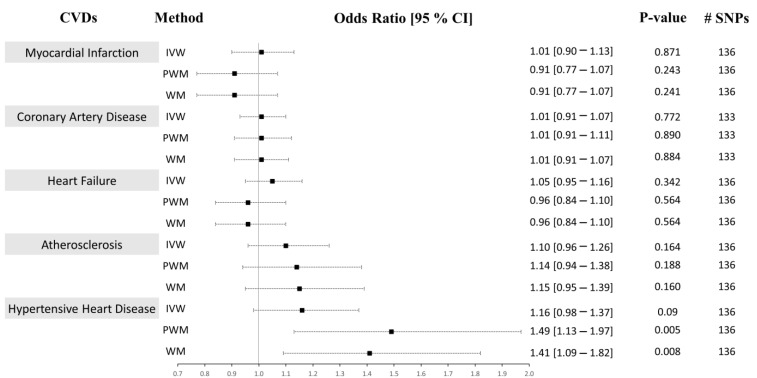
Figure 4.
Causal associations between CRP levels and CVD using Approach 2. MR estimations were performed using IVW as the primary method and PWM and WM as sensitivity analyses. The effect sizes are shown by a black square with 95% confidence intervals as black dashed lines. The number of SNPs found in the outcome GWAS is shown in the #SNPs column. Abbreviations: cardiovascular disease: CVD, inverse-variance weighted: IVW, weighted median: WM, penalized weighted median: PWM, 95% confidence interval: 95% CI.

