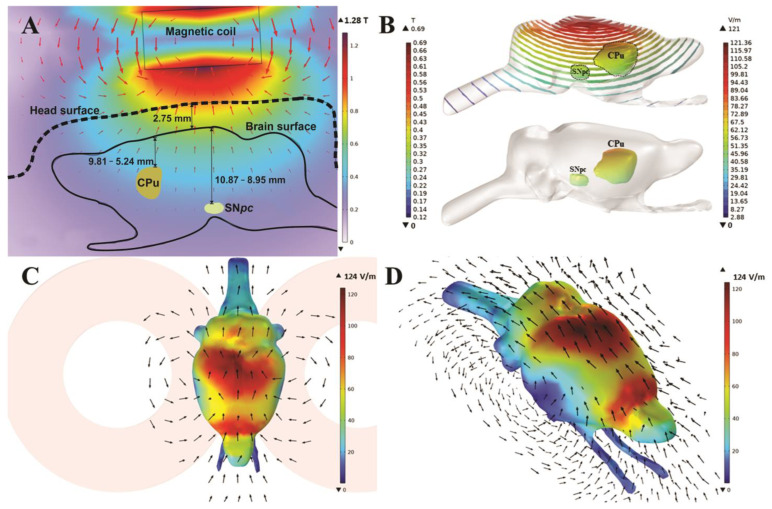
Figure 2.
Heat maps of magnetic field (A,B) and electric field (C,D) measured in the stimulated iTBS FEM model. Representative FEM models of iTBS stimulation depicting 2D (A) and 3D (B) heat maps of magnetic field and electric fields (C,D). Arrows show the direction of the generated electric field (C,D). Scale bars = 10 mm.

