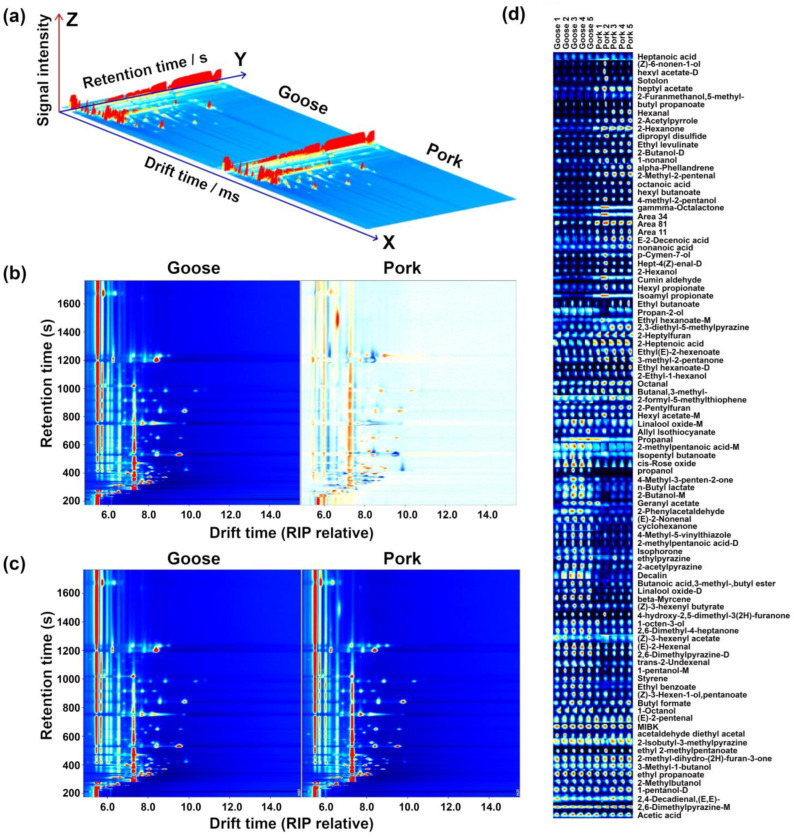
Figure 3.
GC–IMS observations of sour meat fermented from goose and pork. (a) Their three-dimensional representation. (b) Their bird’s-eye view representation, with spectra from goose meat employed as a reference and the corresponding spectra from pork represented as differences from goose meat. In the latter case, red and blue highlight components that were over- and under-expressed, respectively. (c) Their representation as ion migration spectra, where the ions are numbered and then listed in (d) as gallery plots, in which the color was brighter, the content was higher.

