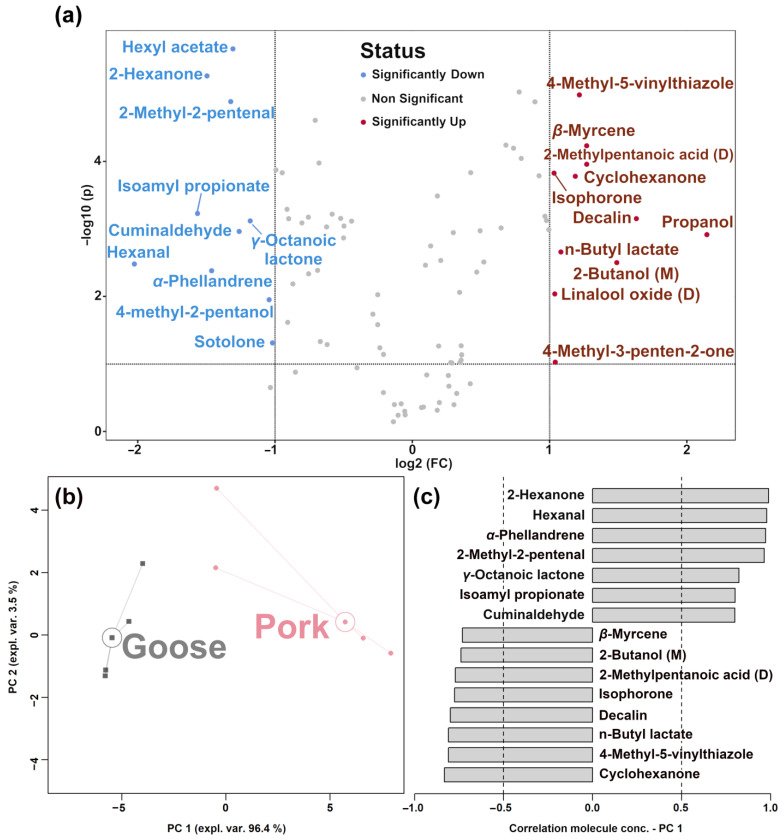
Figure 4.
Volcano plot (a) indicating the changes in the concentrations of metabolites in sour meat samples from the two groups. The RPCA model was set up on the basis of the molecules selected by the volcano plot. In the score plot (b), squares and circles indicate goose and pork samples, respectively. The median of each sample group is indicated by wide, empty circles. The Pearson correlation plot of the loadings (c) shows the molecules with significant correlations between concentration and importance over PC 1 (p < 0.05).

