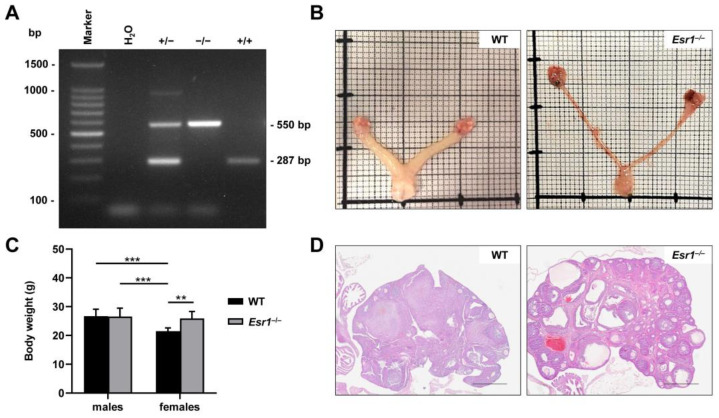
Figure 1.
Depletion of estrogen receptor 1 (Esr1) in mice. (A) Traditional genotyping PCR was performed in wild-type (WT, +/+), Esr1 null (−/−), and heterozygous Esr1 mice (+/−). Top bands (550 bp) represent the depleted and bottom bands (280 bp) of the WT alleles. Heterozygous animals displayed both alleles. (B) Representative reproductive tracts from adult WT and knockout females were placed on scale paper to examine phenotypical changes. (C) Total body weights of WT (female n = 9, male n = 8) and Esr1−/− mice (female n = 6, male = 8) were measured and are shown as means ± SD. For statistical analysis, a two-way ANOVA was performed. Significant differences between groups are indicated by asterisks: ** p < 0.01, *** p < 0.001. (D) Hematoxylin and eosin staining was performed for histological analysis of female ovaries taken from WT and Esr1 null mice. Scale bars: 500 µm.

