Figure 5.
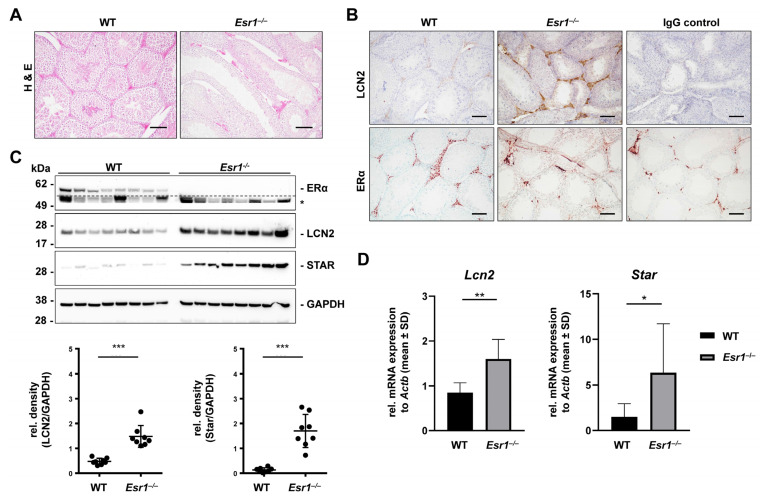
Esr1-deficient testes show increased LCN2 and STAR expression. Testes from wild-type (WT, n = 8) and Esr1−/− null mice (n = 8) were either embedded in paraffin for immunostaining or processed for protein and RNA analyses. (A) Hematoxylin and eosin (H & E) staining was performed to acquire a histological overview. (B) Testes sections were subjected to LCN2 or ERα immunohistochemistry and counterstained with either hematoxylin (LCN2) or methyl green (ERα). Magnifications: 100×; scale bars: 100 µm. (C) LCN2, ERα, and STAR protein expression was analyzed by Western blot analysis. Probing with a GAPDH-specific antibody was used to demonstrate equal protein loading. Unspecific bands are marked with asterisks (*) and are separated from specific bands by dashed lines. Protein expression of LCN2 and STAR was quantified densitometrically and plotted relative to GAPDH expression. Mann–Whitney tests (LCN2) or Student’s t-tests (STAR) were used for statistical analysis. Significant differences between groups are indicated with asterisks: *** p < 0.001. Data are displayed as means ± SD. (D) Results were validated by RT-qPCR. Data are displayed as mean ± SD. For statistical analysis, a Student’s t-test was conducted. Significant differences between groups are marked with asterisks: * p < 0.05, ** p < 0.01.

