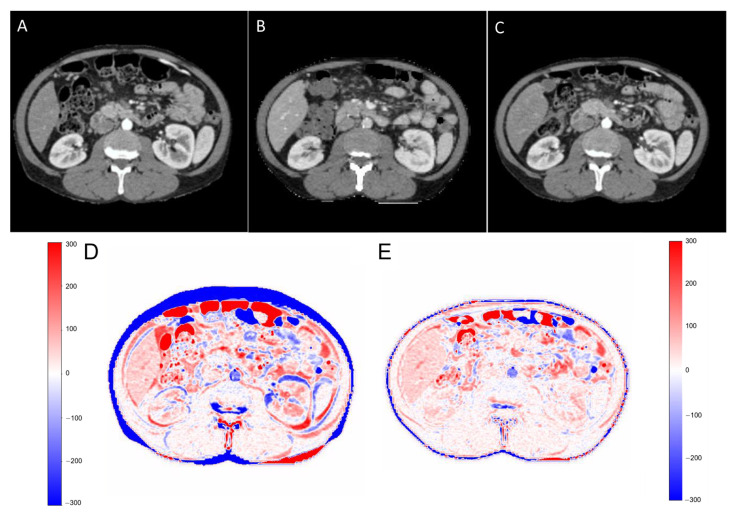
Figure 6.
First row: The diagnostic CT (A), planning CT (B), and synthesized CT (C) at abdominal level/in abdominal window (40/400). Second row: (D) the HU intensity difference map between planning CT and diagnostic CT (pCT–dCT) and (E) between planning CT and synthesized CT (pCT–sCT). deepPERFECT’s predicted synthesized CT from diagnostic CT shows a high similarity to planning CT.

