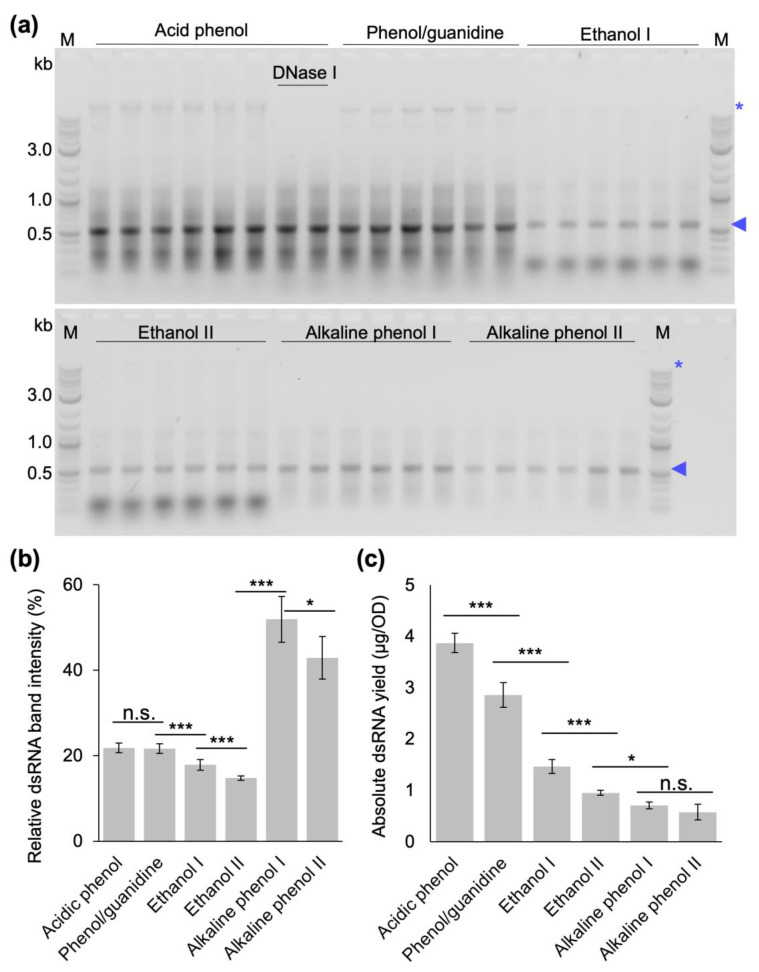
Figure 6.
Comparative gel electrophoretic analysis, relative and absolute yield of dsRNA extracted from bacterial cells with different extraction protocols. Extractions were performed from cells induced at OD600 0.4 with the acid phenol-based protocol developed in this study, the phenol–guanidine-based protocol established by Ongvarrasopone et al. [29] (Phenol/guanidine), the ethanol-based protocols established by Posiri et al. [32] (Ethanol I) or Papić et al. [33] (Ethanol II), the alkaline phenol-based protocols established by Ahn et al. [31] (Alkaline phenol I) or Solis et al. [30] (Alkaline phenol II). (a) Agarose gel electrophoresis of extracted dsRNA. Shown are the results of two technical replicates (i.e., extractions) from three biological replicates (i.e., bacterial cultures) for each extraction protocol. The product of the acid phenol-based protocol developed in this study with an additional DNase I digestion for one of the biological replicates is also shown. In all lanes, the equivalent of 0.4 OD of cells was loaded. (b) Relative dsRNA amount per lane (integrated density of the dsRNA band compared to the integrated density of the whole lane quantified by Adobe Photoshop (Adobe Inc., 2023, San José, CA, USA)). Data are based on gel shown in (a). (c) Absolute amount of dsRNA obtained from one OD of cells, calculated from the spectrophotometric analysis (absorbance at 260 nm) and the relative band intensities in (b) for each of the protocols tested. n.s. = no statistically significant difference. * statistically significant difference, p-value < 0.05, *** statistically significant difference, p-value < 0.001 (one-way ANOVA, Holm–Sidak method for all pairwise multiple comparison). Blue arrowheads indicate extracted dsRNA, blue asterisks indicate bacterial DNA. M: 1 kb plus ladder (New England BioLabs Inc., Ipswich, MA, USA).

