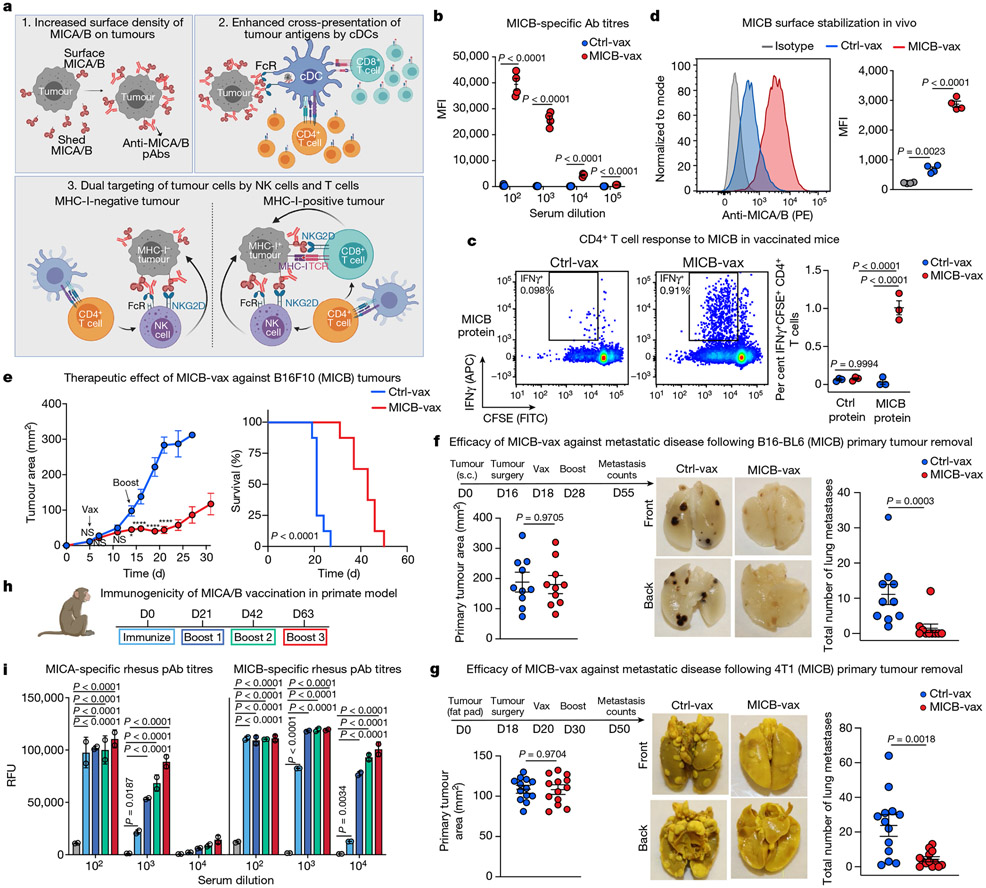
Fig. 1 ∣. Efficacy of the MICA/B α3 domain cancer vaccine.
a, Design of the MICA/B vaccine. pAbs, polyclonal serum IgG. b, MICB-specific serum antibody (Ab) titres quantified by flow cytometry (n = 4 mice per group) in MICB-transgenic mice immunized with Ctrl-vax (blue) or MICB-vax (red). MFI, median fluorescence intensity. c, MICB-specific CD4+ T cell responses following immunization with MICB-vax or Ctrl-vax; CFSE dilution of splenocytes stimulated with MICB or control protein (ovalbumin (OVA)); shown are representative flow cytometry plots (left) and quantification for three mice per group (right). d, Cell-surface levels of MICB on B16F10 (MICB) tumours from mice immunized with MICB-vax or Ctrl-vax (n = 4 mice per group); staining of tumour cells with isotype-control monoclonal antibody (grey) or anti-MICA/B monoclonal antibody (specific for the α1–α2 domains, monoclonal antibody not blocked by vaccine-induced antibodies). e, Therapeutic efficacy of MICB-vax (red) or Ctrl-vax (blue) in mice with established B16F10 (MICB) tumours immunized at the indicated time points (n = 7 mice per group). Vax, vaccination. *P = 0.0137, ****P <0.0001; NS (not significant), P > 0.999. f, g, Vaccine efficacy in two models of spontaneous metastasis. Mice were immunized with Ctrl-vax (blue) or MICB-vax (red) following surgical removal of primary tumours using the B16-B6 melanoma (f; 10 mice per group) or 4T1 breast cancer (g; 13 mice per group) models. Shown are the size of primary tumours at the time of surgery (left), representative images of lung metastases (middle) and quantification of the total number of lung surface metastases (right). D, day; s.c., subcutaneous. h, i, Immunogenicity of the rhesus MICA/B α3 domain vaccine in the rhesus macaque model. h, Timeline of vaccination; blood was drawn 24 h before indicated immunization or boost. i, Serum titres of antibody to rhesus MICA/B for animal ID 9312. Representative data are shown from at least three (b) or two (c–g) independent experiments. Data from a single experiment with technical replicates for each time point are shown in i. Statistical significance was assessed by two-tailed unpaired Student’s t test (b), two-way ANOVA with Sidak’s multiple-comparison test (c), one-way ANOVA with Tukey’s multiple-comparison test (d), two-way ANOVA with Bonferroni’s post hoc test (left) and the log-rank (Mantel–Cox) test (right) (e), two-tailed Mann–Whitney test (f, g) and two-way ANOVA with Tukey’s multiple-comparison test (i). Data are depicted as the mean ± s.e.m. (b–g) or mean±s.d. (i).

