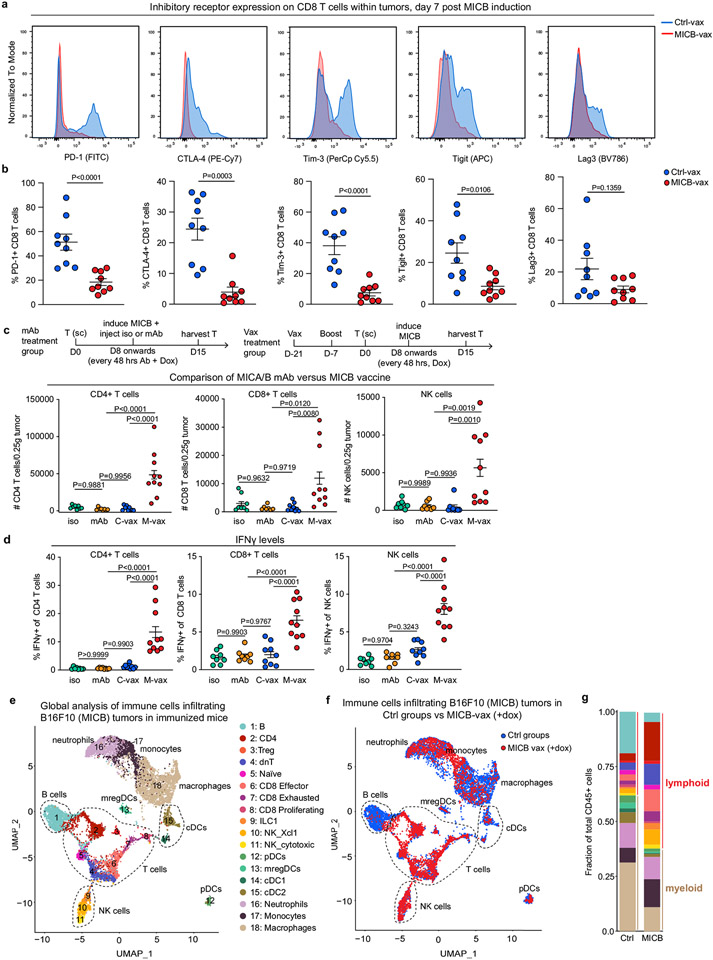
Extended Data Fig. 6 ∣. Flow cytometric and scRNA-seq analysis of changes in tumor-infiltrating immune cells induced by the vaccine.
a–b, Representative histograms (a) and quantification (b) of PD-1, CTLA-4, Tim-3, Tigit and Lag3 expression by tumor-infiltrating CD8 T-cells from Ctrl-vax (blue) or MICB-vax (red) mice (n = 9 mice/group). c–d, Comparison of T-cell and NK cell populations in B16F10 (MICB) tumors following treatment with a MICA/B mAb or the MICB vaccine. In the vaccine arm, mice received Ctrl-vax (C-vax) (n = 9 mice) or MICB-vax (M-vax) (n = 10 mice) on days 0 and 14, while mice in the mAb treatment group (n = 8 mice/ group) received two buffer injections. Mice were implanted with B16F10 (MICB-dox) tumor cells on day 21. MICB expression was induced on tumor cells by doxycycline treatment starting on day 28, and mice in the mAb treatment group received either mouse IgG2a isotype control mAb (iso) or MICA/B mAb (mAb) treatment every 48 h starting on day 28. Tumor-infiltrating immune cells were analyzed in all groups on day 35. Total numbers of tumor-infiltrating CD4+ T-cells, CD8+ T-cells and NK cells were quantified by flow cytometry (c), and intracellular staining was performed for IFNγ (d) in all four treatment groups. e–g, scRNA-seq analysis of changes in tumor-infiltrating immune cells induced by the vaccine. CD45+ immune cells in B16F10 (MICB-dox) tumors were investigated by scRNA-seq under four experimental conditions: the MICB-vax (+dox) experimental group and the three control groups, Ctrl-vax (−dox), Ctrl-vax (+dox) and MICB-vax (−dox). Doxycycline was administered to mice for seven days prior to scRNA-seq analysis to induce MICB expression on tumor cells in two of these groups (+dox). For each of the four groups, CD45+ immune cells were pooled from five mice to reduce variation from individual tumors. e, UMAP projection of CD45+ immune cells combined from all experimental groups. Major immune cell populations are annotated based on differentially expressed genes. f, Comparison of immune subpopulations across all clusters for the experimental MICB-vax (+dox) group (red) versus the three combined control groups (blue). g, Distribution of CD45+ cells across individual clusters (color-coded as in e) for the experimental MICB-vax (+dox) group (MICB) and the three combined control groups (Ctrl). Representative data of two experimental repeats (a–b). Data from a single experiment (c–d). ScRNA-seq data from a single experiment with sorted CD45+ cells pooled from 5 mice/group (e–g). Two-tailed Mann Whitney test (b); one-way ANOVA with Tukey’s multiple comparison test (c–d). Data depict mean+/− SEM.

