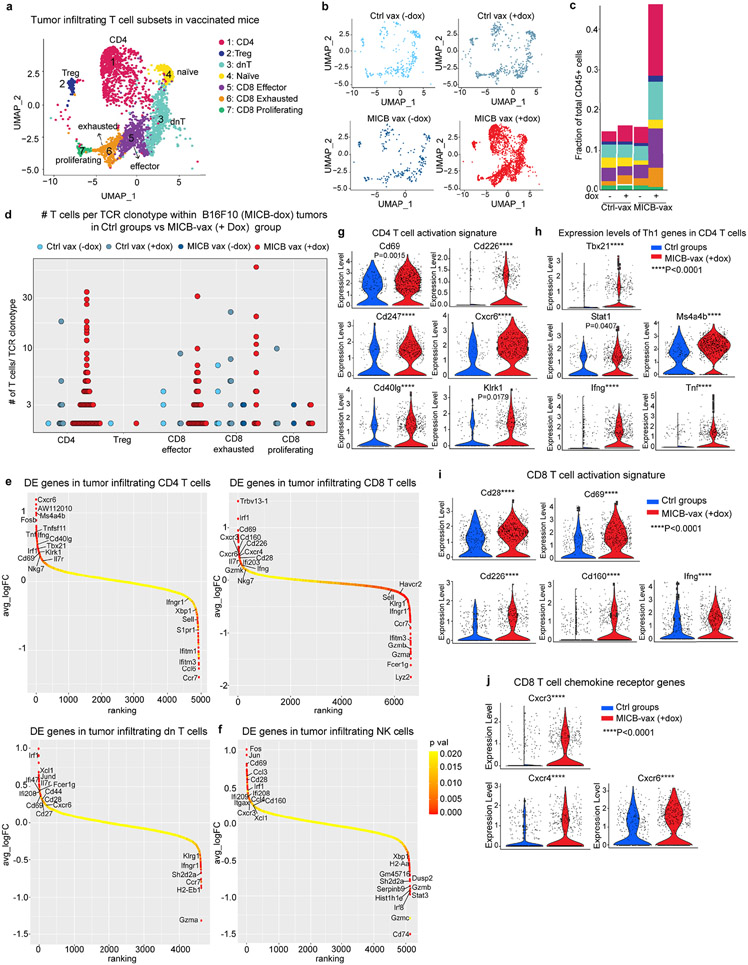
Extended Data Fig. 7 ∣. Gene expression programs of tumor-infiltrating T-cell and NK cell populations.
a–d, scRNA-seq analysis of T-cell clusters among CD45+ tumor-infiltrating cells in B16F10 (MICB-dox) tumors. UMAP representation of T-cell subclusters (a) and visualization of T-cell populations for the experimental MICB-vax (+dox) group (MICB) and the three control groups (b). c, Contribution of each T-cell subcluster to the total CD45+ immune population for each of the four treatment groups. d, Quantification of expanded TCR clonotypes for CD4, Treg, CD8 effector, CD8 exhausted and CD8 proliferating clusters shown for all four treatment groups. e, f, Ranking of differentially expressed genes in scRNA-seq data from the indicated T-cell subpopulations (e) and NK cells (f) comparing cells from the experimental MICB-vax (+dox) group to cells from the three combined control groups, Ctrl-vax (−dox), Ctrl-vax (+dox) and MICB-vax (−dox). g–j, Violin plots showing expression levels of activation-related genes (g) and Th1-related genes (h) in CD4 T-cells as well as activation-related genes (i) and chemokine receptor genes (j) in CD8 T-cells from the experimental MICB-vax (+dox) group compared to cells from the three combined control groups (Ctrl). ScRNA-seq data from a single experiment with sorted CD45+ cells pooled from 5 mice/group (a–j). Pairwise Wilcoxon rank sum test (g–j).

