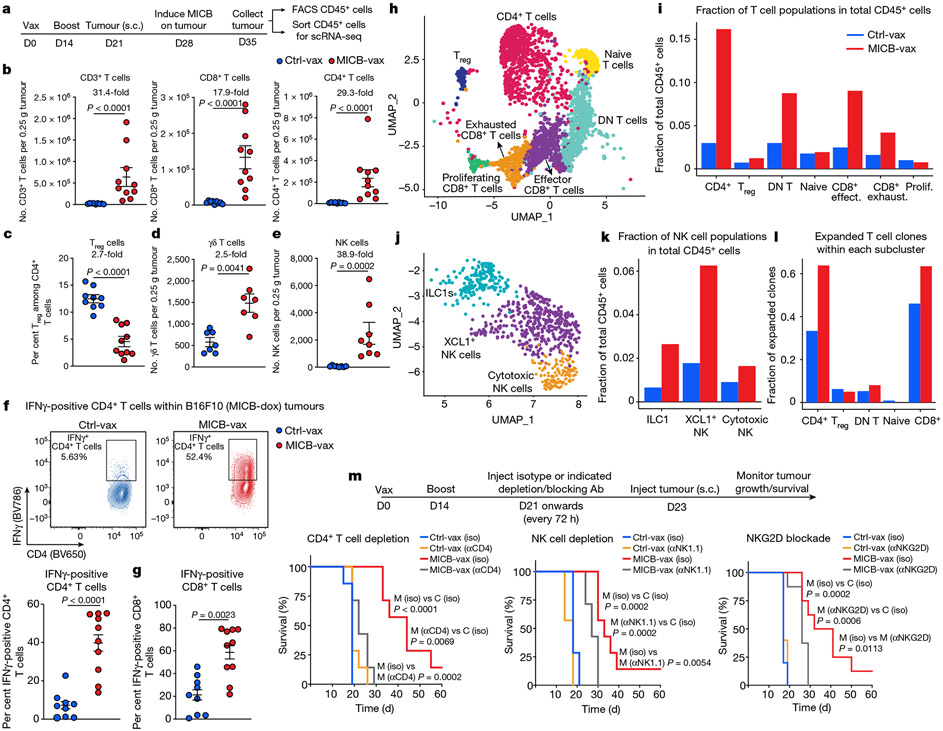
Fig. 2 ∣. Vaccine induces T cell and NK cell recruitment into tumours.
a, Strategy for characterization of tumour-infiltrating immune cells by flow cytometry (FACS) and scRNA-seq. Mice received two immunizations (days 0 and 14), B16F10 (MICB-dox) tumour cells were implanted (day 21), MICB expression was induced on tumour cells by doxycycline treatment (day 28) and tumour-infiltrating immune cells were analysed 7 d later. b–d, Tumour-infiltrating T cell populations following immunization with Ctrl-vax (blue) or MICB-vax (red) (Ctrl-vax, n = 9 mice per group; MICB-vax, n = 10 mice per group; n = 7 mice per group for the γδ T cell panel). Treg cells, regulatory T cells. e, Tumour-infiltrating NK cells (n = 8 mice per group). f, g, Quantification of IFNγ-positive CD4+ and CD8+ T cells (Ctrl-vax, n = 9 mice per group; MICB-vax, n = 10 mice per group). h, i, UMAP representation of all T cell clusters from scRNA-seq data (h) and the fraction of each T cell subpopulation among total CD45+ cells from the experimental group (MICB-vax + doxycycline; red) and three combined control groups (Ctrl-vax±doxycycline and MICB-vax without doxycycline; blue) (i). DN, double negative. j, k, UMAP representation of NK and ILC1 cells from all experimental groups (j) and the fraction of these subpopulations among total CD45+ cells from experimental (red) and combined control (blue) groups (k). l, Fraction of T cells representing expanded clones based on TCR sequence analysis for the experimental group (red) and combined control groups (blue). m, Contribution of CD4+ T cells, NK cells and NKG2D receptor to vaccine efficacy. Mice were first immunized with MICB-vax (M) or Ctrl-vax (C) (days 0 and 14) and treated with isotype-control monoclonal antibody (iso), depleting monoclonal antibody (targeting CD4+ T cells or NK cells (αCD4 and αNK1.1, respectively)) or NKG2D receptor-blocking monoclonal antibody (αNKG2D) starting on day 21, followed by implantation of B16F10 (MICB) tumour cells (n = 7 mice per group). Representative data from three independent experiments are shown in b–g. scRNA-seq data from a single experiment with sorted CD45+ cells pooled from five mice per group are shown in h–l. Representative data from two independent experiments are shown in m. Statistical significance was assessed by two-tailed Mann–Whitney test (b–g) or log-rank (Mantel–Cox) test (m). Data are depicted as the mean±s.e.m.

