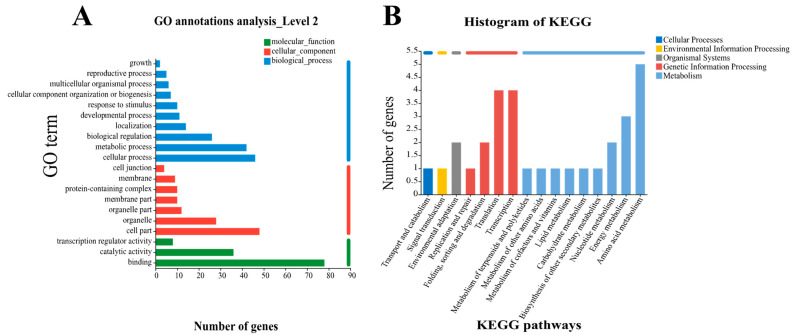
Figure 3.
Mapping and classification of Cd-related genes. (A) is a bar chart of GO classification statistics (single gene set): In the figure, the vertical axis represents the second-level classification terms of GO, the horizontal axis represents the number of genes compared to the second-level classification, and the three colors represent the three classifications. (B) is the enrichment diagram of the KEGG signal pathway. Ordinate is the name of the KEGG metabolic pathway. The x-coordinate is the number of genes or transcripts annotated to this pathway. The upper right corner shows the category of KEGG metabolic pathways.

