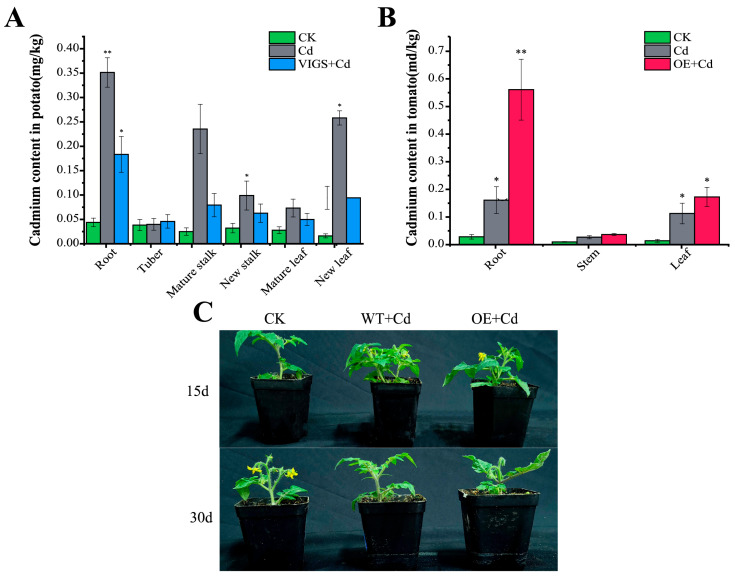
Figure 7.
Effect of StNRAMP2 on Cd tolerance in plants: (A) shows Cd accumulation in different parts of potato. (B) shows Cd accumulation in different parts of tomato. In the figure, * means significant difference p < 0.05, and ** means extremely significant p < 0.01. (C) shows tomato under heavy metal stress. CK was a plant without Cd stress. WT is a wild-type plant; VIGS signifies silenced StNRAMP2 plants; OE is a plant that overexpresses StNRAMP2.

