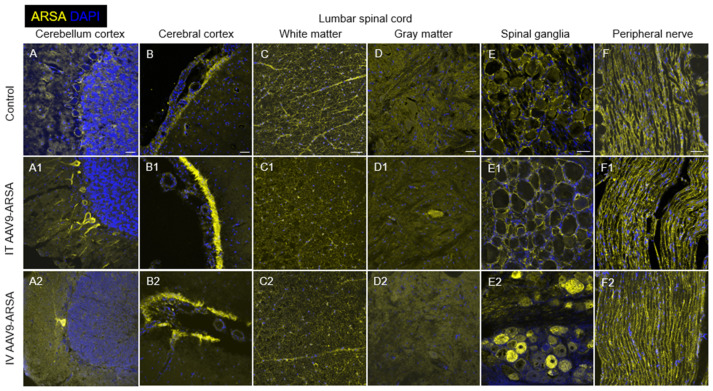
Figure 9.
Assessment of ARSA (yellow) expression in different regions of nervous tissue in the control group of animals (A–F) and in experimental groups 1 and 2 on day 35 after the intrathecal (A1–F1) and intravenous (A2–F2) administration of AAV9-ARSA, respectively. Nuclei were stained with DAPI (blue). Scale bar: 50 µm. Control—control group of animals, IT AAV9-ARSA—intrathecal administration of AAV9-ARSA, IV AAV9-ARSA—intravenous administration of AAV9-ARSA vector.

