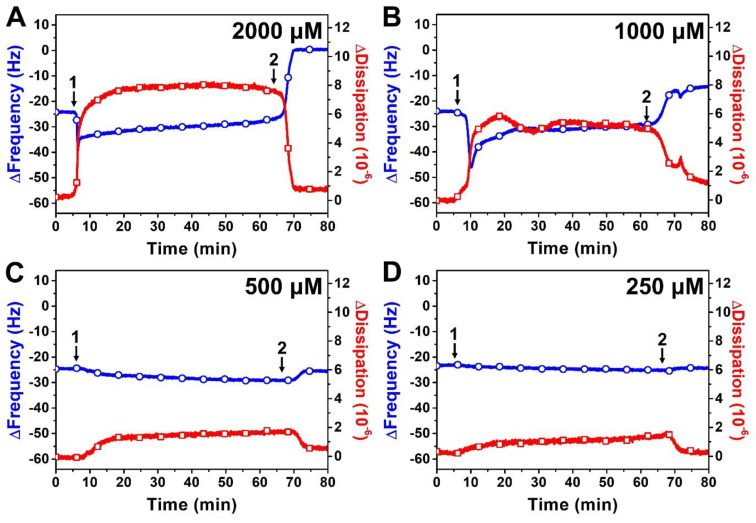
Figure 4.
QCM-D tracking of different concentrations of SLL interactions with supported lipid bilayer (SLB) platform. The resonance frequency (∆f) and energy dissipation (∆D) signals are presented as a function of time for (A) 2000 μM, (B) 1000 μM, (C) 500 μM, and (D) 250 μM SLL. The initial baseline values correspond to the DOPC SLB platform, while arrow 1 specifies the time when test compounds were added (t = 5 min) and arrow 2 shows the time when the buffer washing step commenced (t = 65 min).

