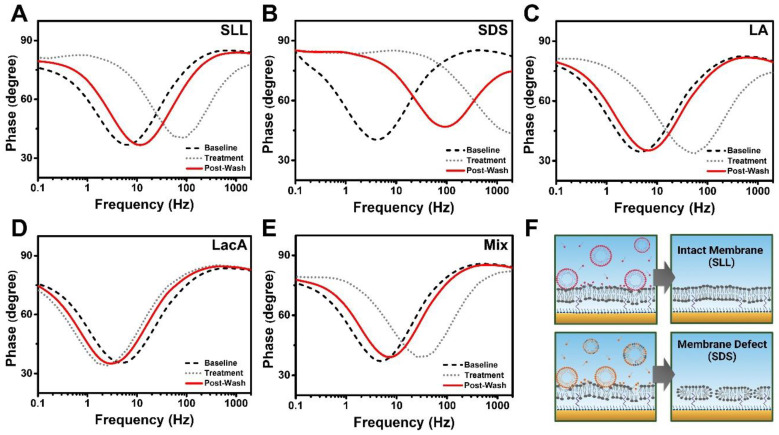
Figure 9.
Bode plot analysis of EIS measurement data. The plots and phase shifts of the tBLM platform due to interactions are presented for (A) SLL, (B) SDS, (C) LA, (D) LacA, and (E) LA + LacA (Mix). Changes in membrane conditions upon compound addition (Treatment) and after buffer washing (Post-Wash) were evaluated from plot shifts compared with the original state of membranes (Baseline). (F) Schematic illustrations of interactions between the tBLM platform and SLL or SDS upon compound addition and in the final state after buffer washing based on the Bode plots. SLL modestly disrupted the tBLM platform in a more transient manner, but the membrane remained intact (top panel), while SDS removed lipids from the membrane and caused permanent membrane defect formation (bottom panel).

