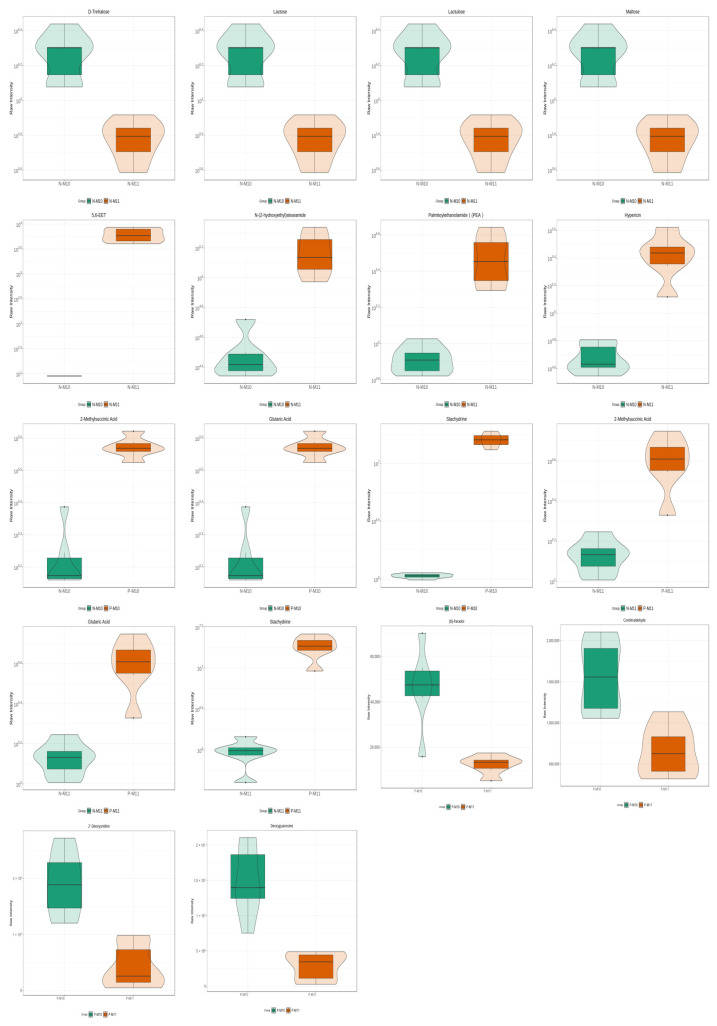
Figure 4.
Representatives of the differential metabolites from E. sinensis. The box in the middle represents interquartile range. The 95% confidence interval is presented as a black line that penetrates through the box. The black line in the middle of the box is the median. The outer shape describes the density of distribution.

