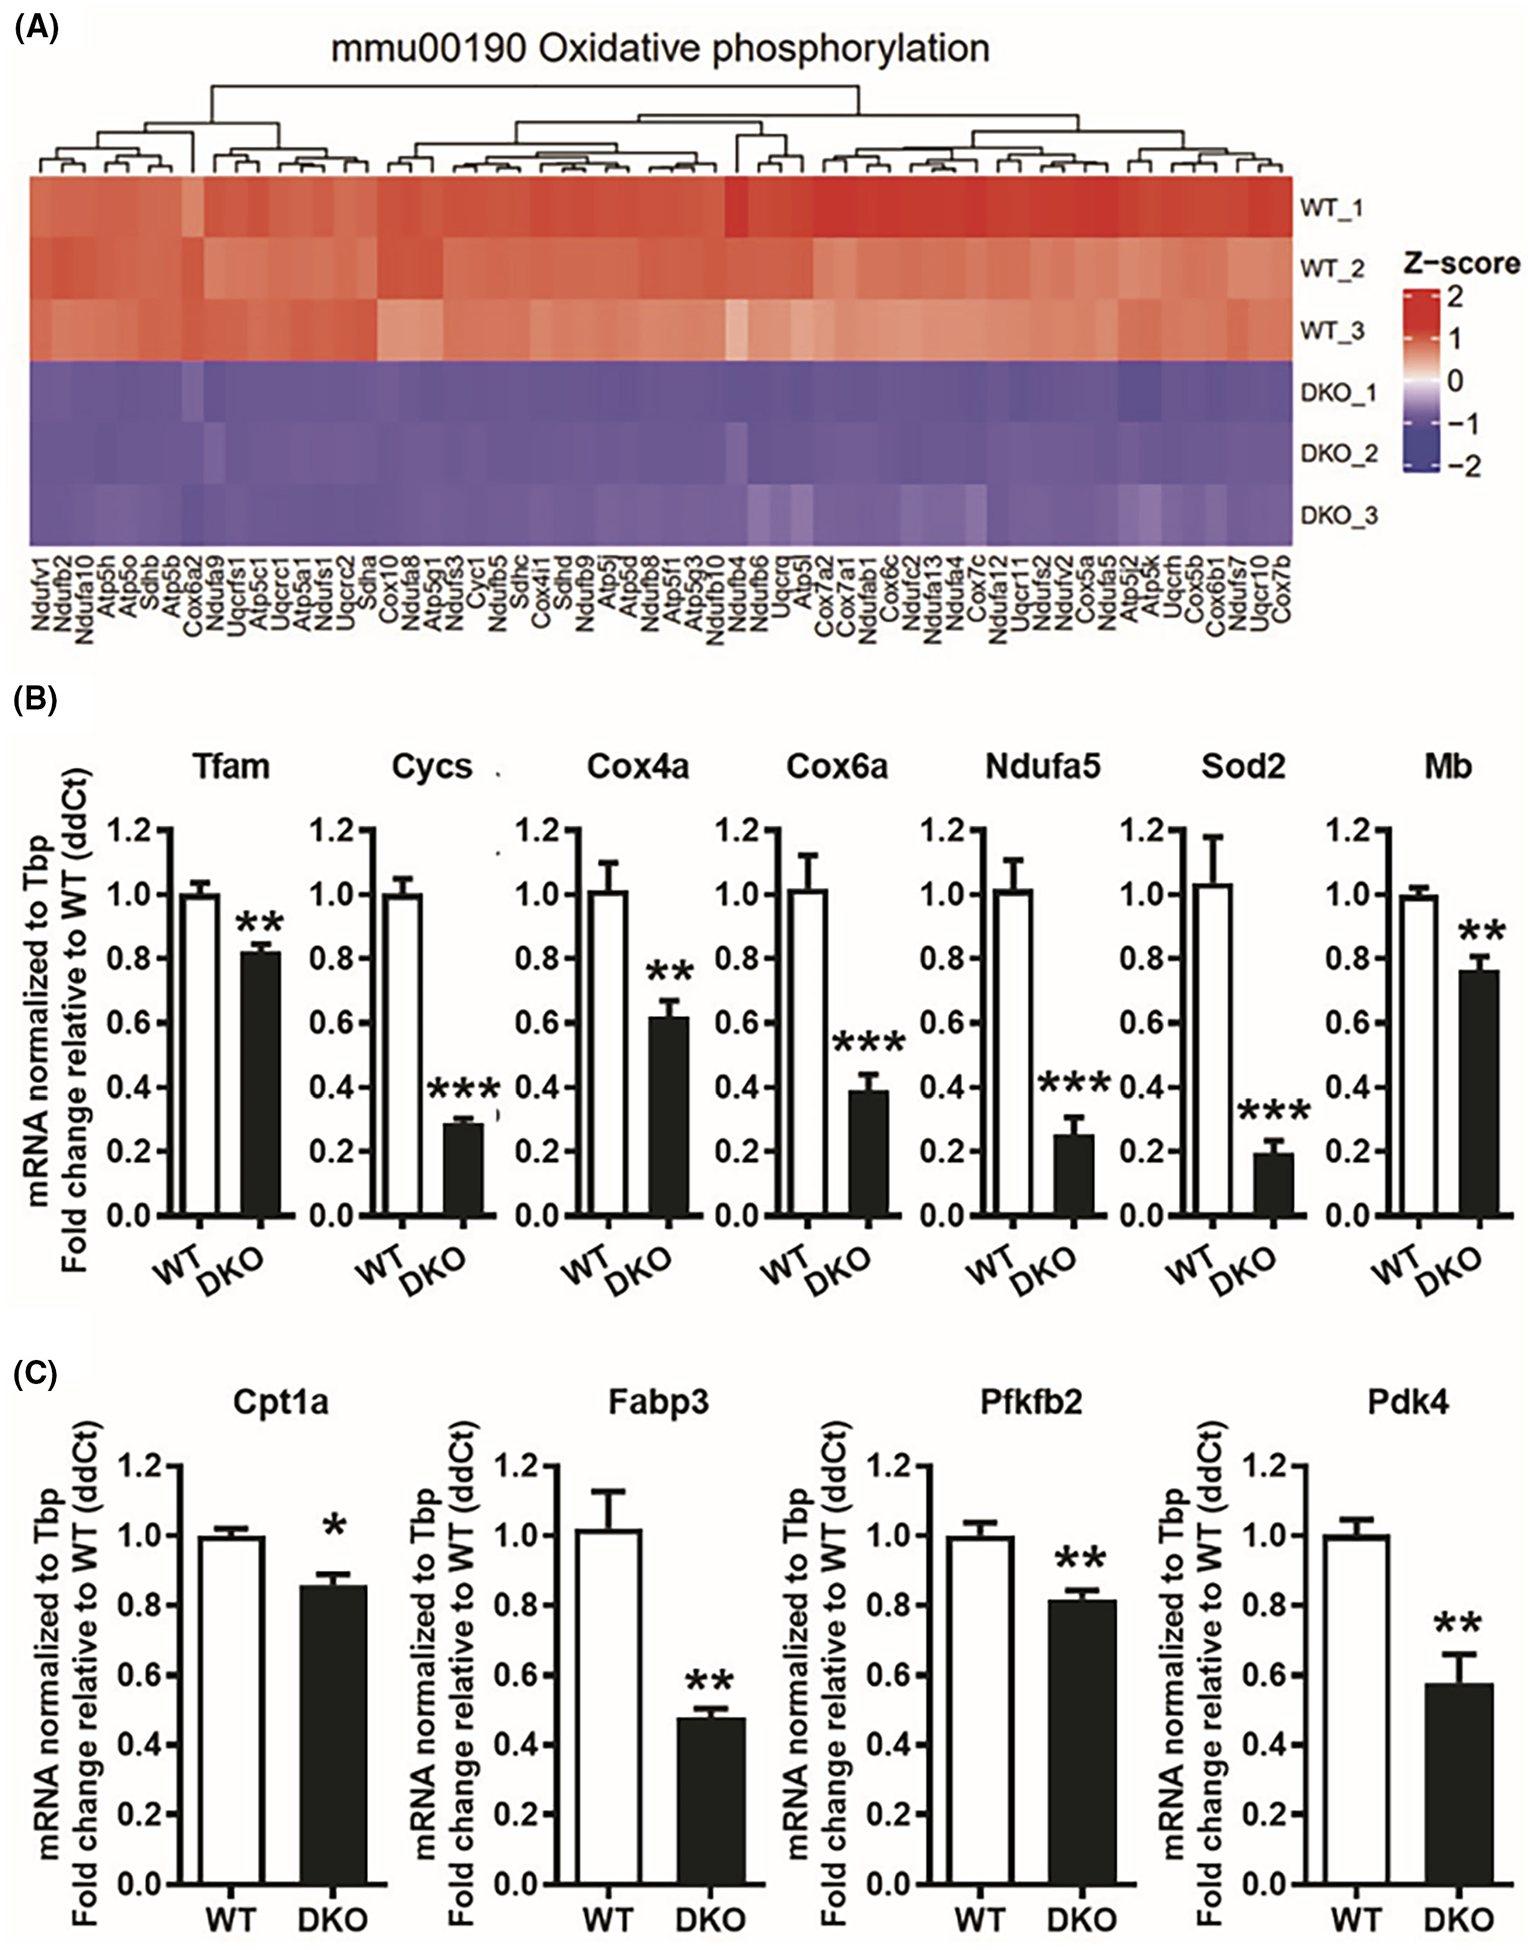
FIGURE 3.

Decreased expression of oxidative phosphorylation genes in ERRα/γ deficient muscles. (A) Heat map showing the downregulation (Z-score scaled) of oxidative phosphorylation-linked genes in DKO versus WT gastrocnemius muscles (N = 3). (B) QPCR analysis of mitochondrial gene expression in DKO compared to WT gastrocnemius muscle (N = 5). (C) QPCR analysis of fatty acid oxidation genes in DKO versus WT muscle (N = 5). *p < .05, **p < .01, and ***p < .001. Unpaired Student’s t-test.
