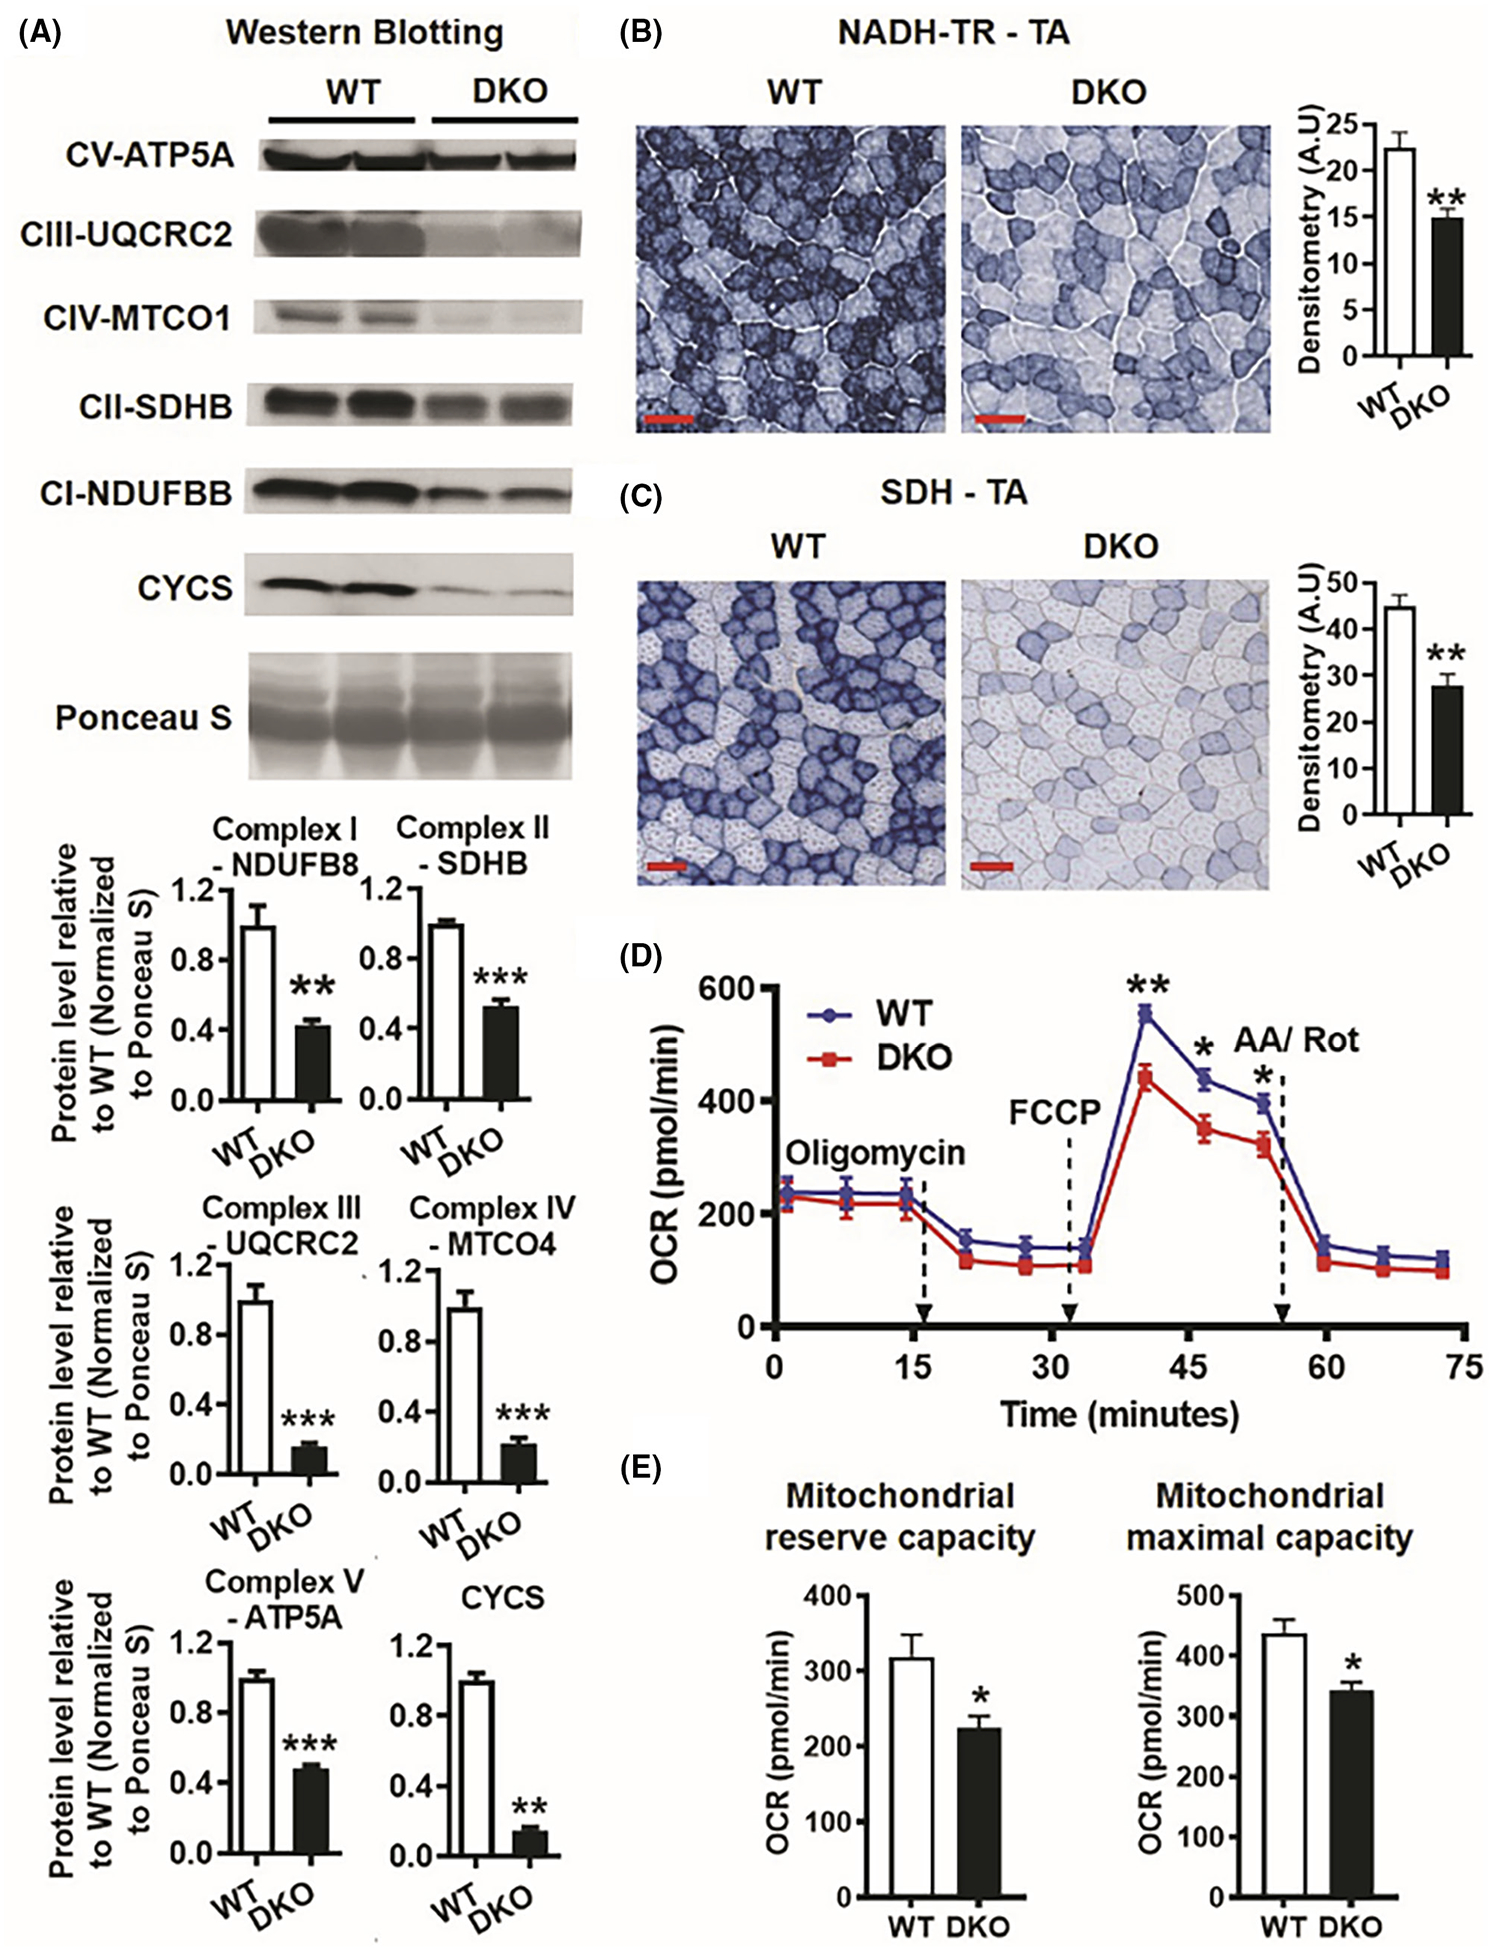
FIGURE 4.

Mitochondrial dysfunction in ERRα/γ deficient muscles. (A) Western blotting and quantification of subunits of mitochondrial electron transport chain complexes I-V and CYCS in DKO versus WT gastrocnemius (N = 5). (B) NADH-TR activity staining in tibialis anterior (TA) cross-sections in DKO compared to WT mice (N = 5). Scale bar (red) = 100 μm. (C) SDH activity staining in TA cross-sections in DKO compared to WT mice (N = 5). Scale bar (red) = 100 μm. Left panel—representative images. Right panel—quantification. (D) Seahorse respirometry assay using mitochondrial stress test in FDB singe fibers in DKO versus WT mice (N = 6 mice). (E) Quantification of mitochondrial reserve capacity and maximal capacity in WT and DKO FDB myofibers by Seahorse respirometry. (N = 6). **p < .01 and ***p < .001. Unpaired Student’s t-test.
