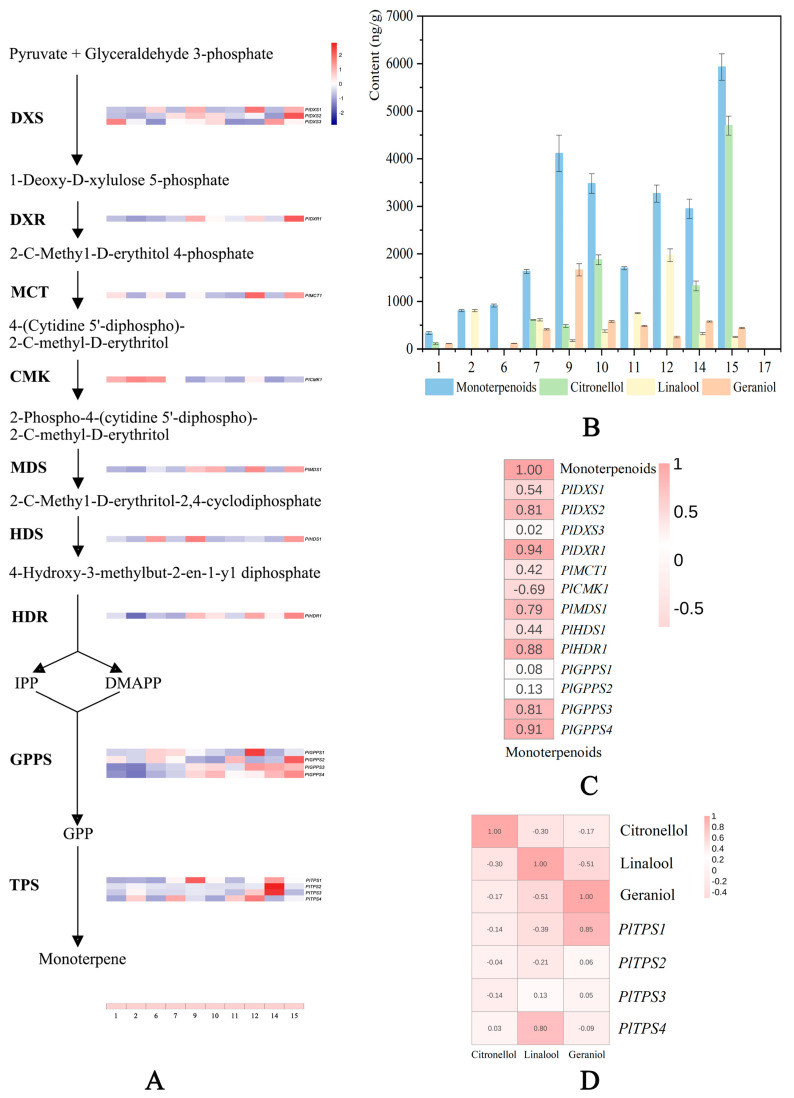
Figure 7.
MEP pathway in herbaceous peony. The numbers 1−17 represent 17 cultivars, and numbers assigned are described in Figure 2. (A) Expression pattern of genes involved in the MEP pathway of herbaceous peony. Gene expression levels in different cultivars are represented by color gradations. (B) The relative contents of monoterpenes, citronellol, linalool, and geraniol in 11 cultivars. The detailed data are sourced from Figure 4 and Figure 5 and Supplementary Table S4. (C) Correlation heat map between monoterpenes release and gene expression levels. Correlation levels are represented by color gradations. (D) Correlation heat map between citronellol, linalool, and geraniol releases and TPS gene expression levels. Correlation levels are represented by color gradations. Three biological replicates of the experiments were carried out.

