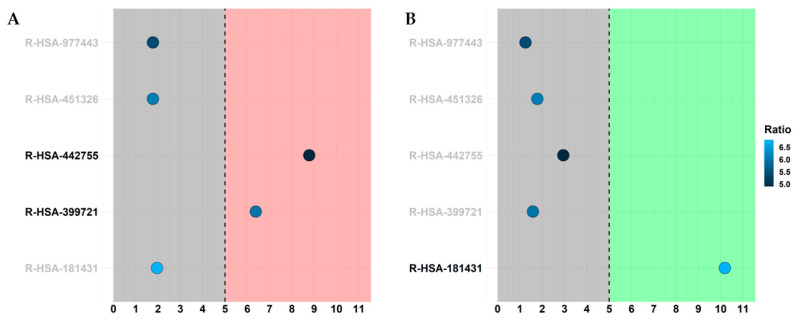
Figure 5.
Bubbleplot of the Reactome pathways for glutamatergic, cholinergic and gabaergic synapses. The x-axis represents a score obtained by −log2(FDR), so that pathways with score higher than 5 are significantly upregulated (red region in panel (A)) or downregulated (green region in panel (B)). Each point is filled with the color obtained with a score computed as −log2(entities ratio).

