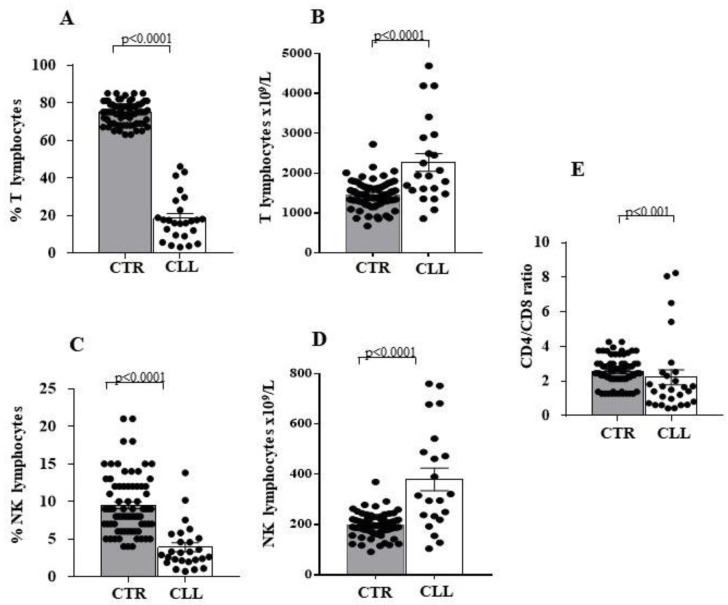
Figure 1.
Significant decrease in the percentage, associated with increased number characterises circulating T and natural killer (NK) cells of chronic lymphocytic leukaemia (CLL) subjects with stable disease. Panels (A,C) indicate the percentage of circulating T and NK lymphocytes; panels (B,D) indicate the number of T and NK cells in peripheral blood; panel (E) shows the CD4/CD8 T-cell ratio of circulating lymphocytes. Comparative analysis of LLC and healthy controls shows decreased percentage of circulating T and NK effectors associated with a significant increase in their number. Grey and white columns indicate data obtained in healthy controls (CTR in x axis) and CLL individuals (CLL in x axis), respectively. Statistical evaluation of data has been performed by means of the Mann–Whitney test. Statistical significance values are indicated. The applied flow cytometry gating strategy is reported in Section 4.2.

