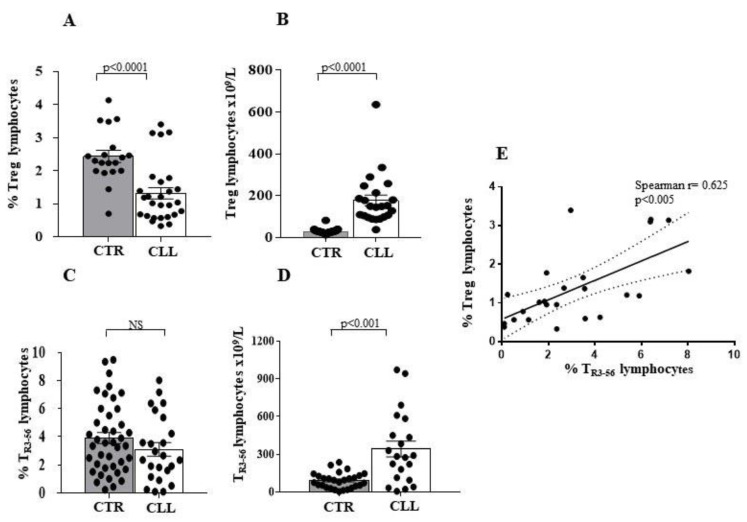
Figure 2.
Analysis of circulating CD4+CD25+ (Treg) and CD3+CD56+ (TR3-56) regulatory T-cell subsets in CLL subjects with stable disease. Panel A to D show comparative analysis of the percentage and the number of circulating Treg and TR3-56, in CLL subjects and healthy controls. Decreased percentage (A) and increased number (B) of the Treg cells has been shown to be associated with not significant difference in percentage of circulating TR3-56 lymphocytes (C) and increased number of this T-cell subset (D) in the CLL cohort. Grey and white columns indicate data obtained in healthy controls (CTR in x axis) and CLL individuals (CLL in x axis), respectively. Statistical evaluation of data has been performed by means of the Mann–Whitney test. Panel (E) shows the significant correlation, as evaluated by Spearman’s test, between percentage of circulating Treg and TR3-56 lymphocytes in CLL subjects. Statistical significance values are indicated. NS indicates the not statistically significant value. The applied flow cytometry gating strategy is reported in in Section 4.2.

