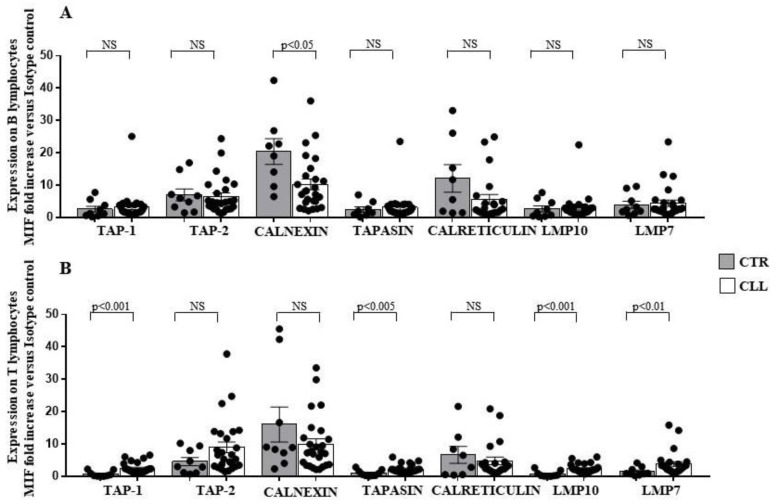
Figure 6.
Significant decrease in intracellular calnexin expression in B lymphocytes, associated with up-regulation of TAP-1, Tapasin, LMP7 and LMP10 in the T-cell compartment, characterises CLL subjects with stable disease. Panel (A,B) show TAP-1, TAP-2, calnexin, tapasin, calreticulin, LMP10 and LMP7 intracellular expression in B- and T-cell compartment, as indicated. As shown, significant decrease in intracellular calnexin has been observed in the B cells of the CLL subjects, as compared with controls; at variance significant increase in TAP-1, Tapasin, LMP10 and LMP7 was revealed in the T lymphocytes of the CLL cohort. As detailed in the Materials and Methods Section, intracellular immune-fluorescence data were expressed as ratio of the mean intensity fluorescence (MIF) value for B and T cells and the control MIF value obtained after staining the same cell populations with the isotype control mAb. Grey and white columns indicate data obtained in healthy controls (CTR caption of (A,B) Panels) and CLL individuals (CLL caption of (A,B) Panels), respectively. Statistical evaluation of data has been performed by means of the Mann–Whitney test. Statistical significance values are indicated. NS indicates the not statistically significant value. The applied flow cytometry gating strategy is reported in Section 4.2.

