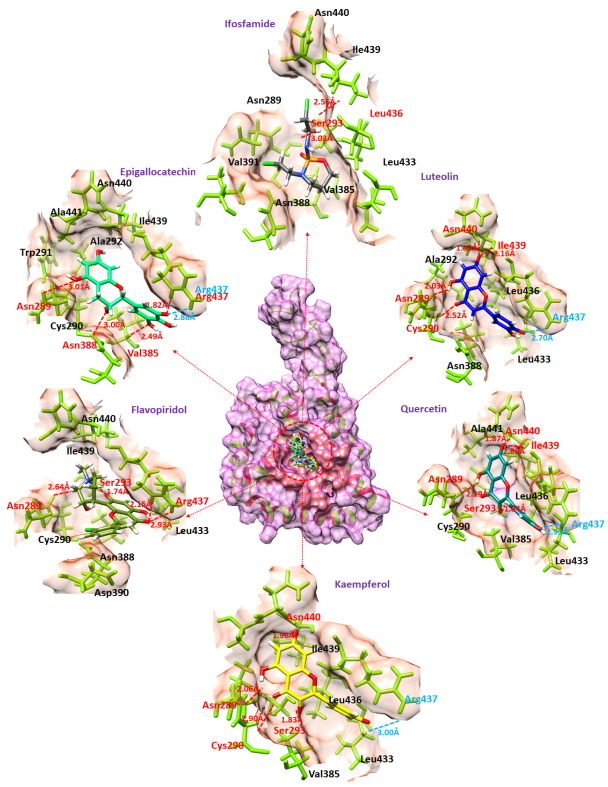
Figure 6.

This figure shows the binding of flavonoid compounds in the active region of the DAX1 protein. The amino acids which are making hydrogen bonds and the binding distances are colored red while the amino acids which are producing salt bridges and the bonding are colored cyan. Furthermore, each flavonoid compound is colored differently (Luteolin (blue), Quercetin (dark cyan), Kaempferol (yellow), Flavopiridol (olive), Epigallocatechin (spring green), and Iforfamide (dim grey).
