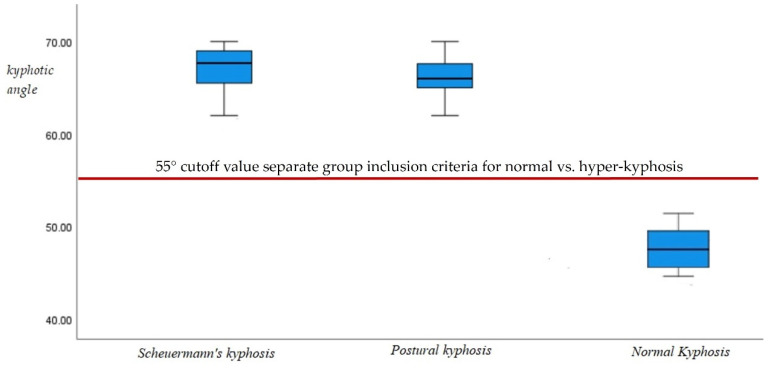
Figure 4.
Box and whisker plots shown of the magnitude of thoracic kyphosis, ICT-ITL (max), in both hyper-kyphotic groups (postural kyphosis, 66.5° ± 3; Scheuermann’s kyphosis; 67.5° ± 4.9) and the normal kyphosis (49° ± 3) groups. A statistically significant difference for these variables between normal kyphosis and total hyper-kyphosis (but not for hyper-kyphosis type) was forced by study design, where 55° (shown as red-dashed line) was the absolute cutoff for kyphosis between groups.

