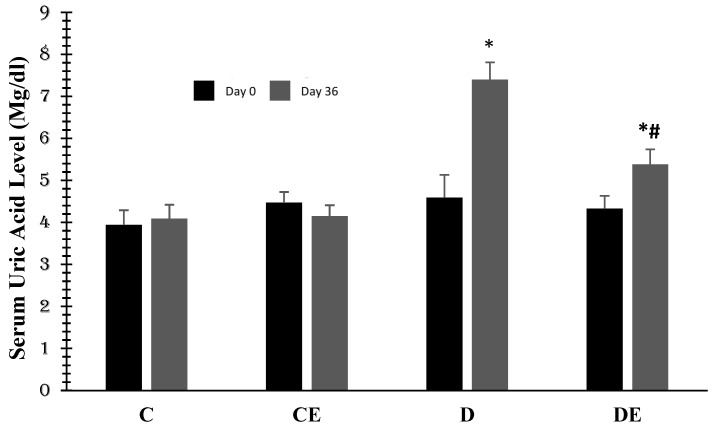
Figure 3.
Mean values of serum uric acid (mg/dL) in all experimental groups; diabetes induction increased it (p < 0.001) in the D group, but empagliflozin therapy reduced it (p < 0.03) at days 36th. (* (p < 0.001)) with a significant difference when compared to the control (C); # (p = 0.03) and a significant difference when compared to the diabetic (D) group (1 = day 0 or first examination, 2 = day 36). (C = control, CE = control plus empagliflozin, D = diabetes, DE = diabetes plus empagliflozin).

