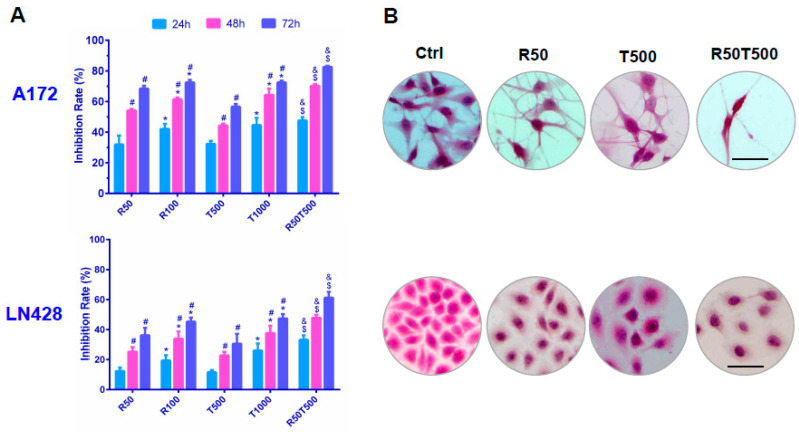
Figure 1.
Evaluation of chemosensitivities of GBM cells to Res, TMZ, or Res + TMZ by CCK-8 (A) and H&E staining (B). All of the results represent the mean ± standard deviation of three independent experiments (n = 3). *, p < 0.05, compared with the former Res or TMZ concentration at the same time point; #, p < 0.05, compared with the former time point with the same Res or TMZ concentration; $, p < 0.05, compared with R50 or T500 at the same time point; &, p < 0.05, compared with T1000 at the same time point. Ctrl, control group; R50, resveratrol 50 μM; R100, resveratrol 100 μM; T500, temozolomide 500 μM; T1000, temozolomide 1000 μM; R50T500, combined treatment of resveratrol 50 μM and temozolomide 500 μM. Scale bar = 50 μm.

