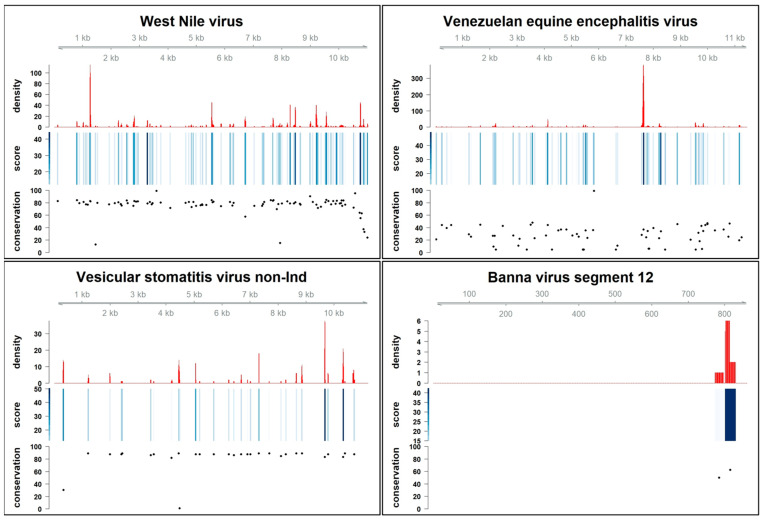
Figure 1.
Presence, density, score and conservation of PQSs in arboviruses. Plots representing the PQS density (red bars), the score (blue bars) and the conservation percentage (black dots) of each predicted PQS. The viral genome length is reported above the density plot. The Vesicular stomatitis virus non-Indiana strains have been abbreviated to Vesicular stomatitis virus non-Ind.

