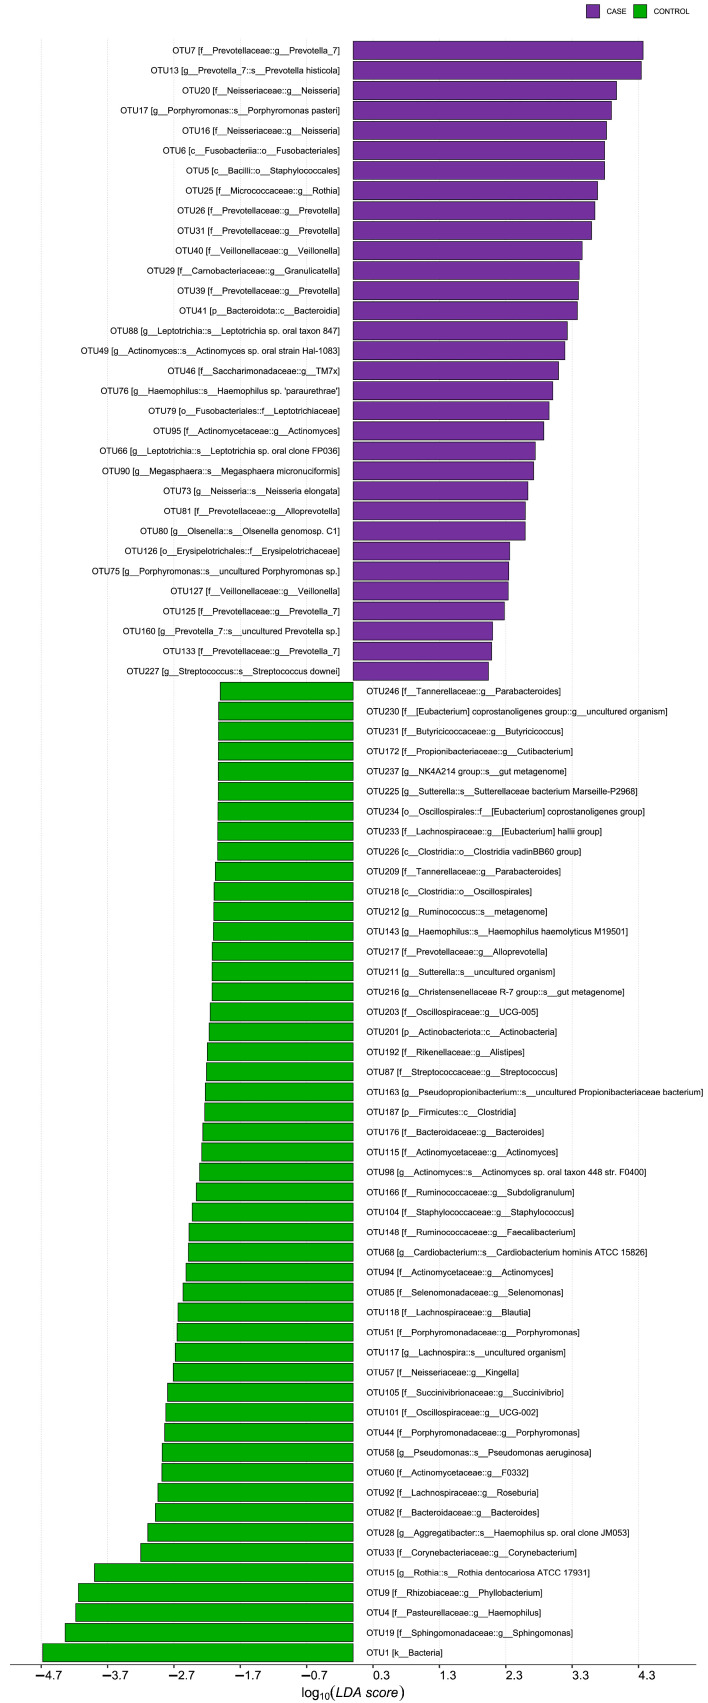
Figure 3.
Taxonomic profile of differences in patients with rheumatoid arthritis. A histogram of LDA scores, where the LDA score indicates the size and ranking of each differentially abundant taxon (LDA > 2). The OTU case group (RA) is highlighted in green and the control group (non-RA) is highlighted in purple.

