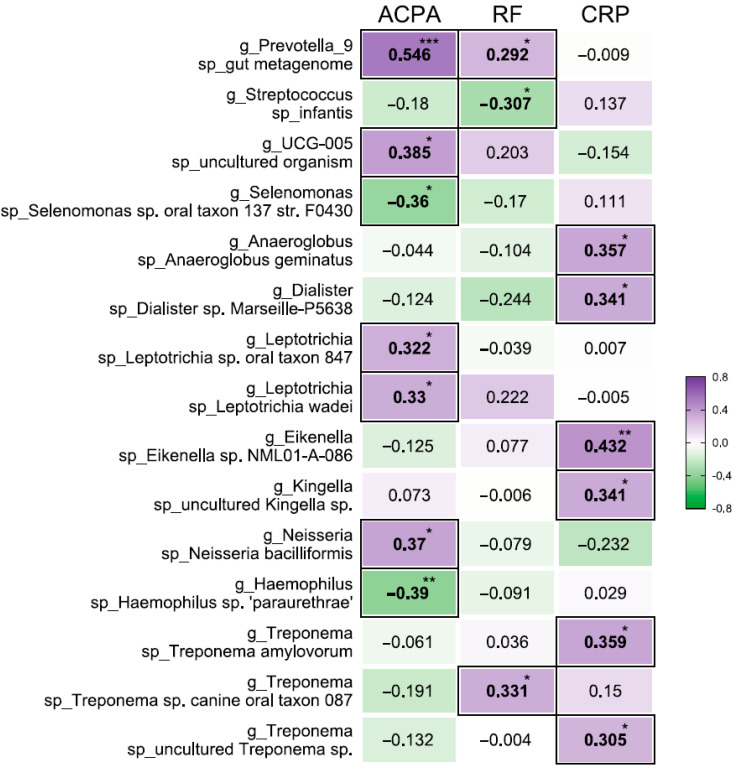
Figure 4.
Association between oral bacterial abundance and systemic signature in patients with RA. Correlation between the relative abundance of certain taxa and concentrations of ACPA and RF and C-reactive protein (CRP) in serum. The color scale represents the magnitude of the correlation. Purple highlights indicate a positive correlation; green highlights indicate a negative correlation. * p < 0.05, ** p < 0.01, *** p < 0.001.

