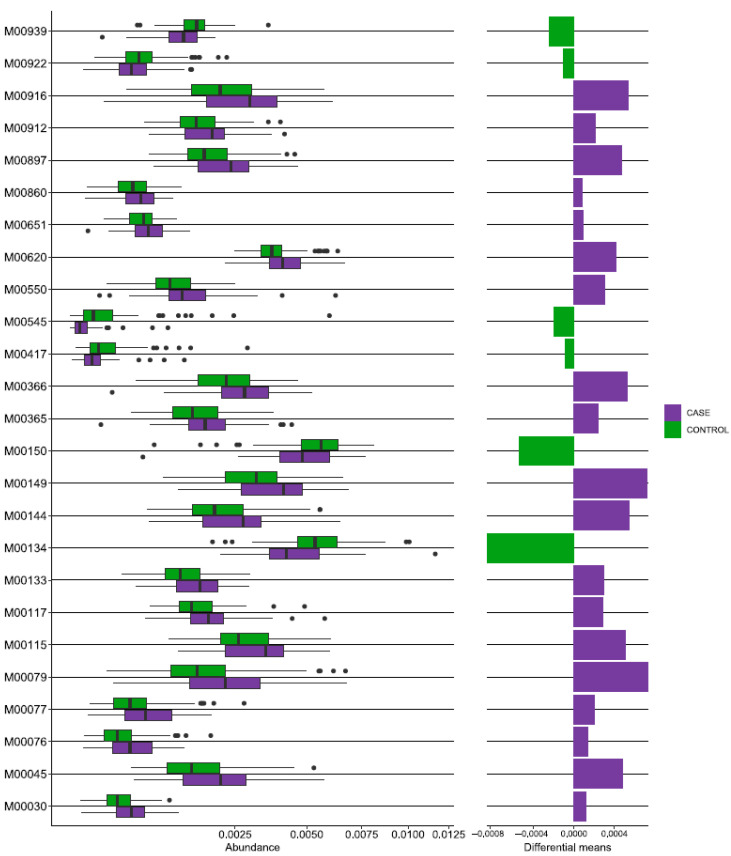
Figure 5.
Functional repertoire prediction of differential KEGG levels by 16S sequencing in the rheumatoid arthritis group. The boxplot shows a comparison of PICRUSt2 predicted KEGG functions between the case (RA) and control groups. The case group is highlighted in purple, and the control group in green.

