Figure 3.
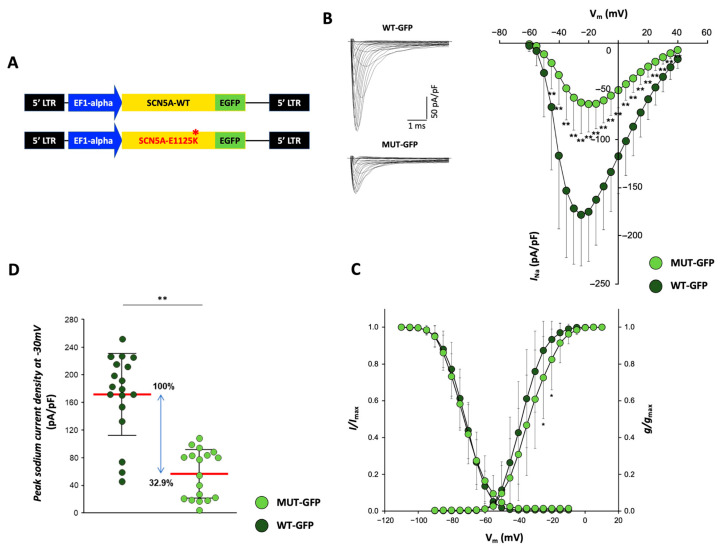
Overexpression of p.E1225K-Nav1.5 leads to reduced peak sodium currents in PSC-CMs. (A) Lentiviral vectors expressing the C-terminal GFP-tagged SCN5A (wild-type and carrying the p.E1225K variant) used to produce the lentiviral particles for overexpression. (B–D) Voltage-gated sodium currents in PSC-CMs. (B) Left panel: examples of Na+ current (INa) traces recorded in CMs overexpressing SCN5A-WT (top—WT GFP) and SCN5A-E1225K (bottom—MUT GFP) (Scale bar, 1 ms, 50 pA/pF). Right panel: I-V curves constructed from average peak sodium current density as a function of voltage command measured in WT GFP-CMs and MUT GFP-CMs, showing a significant reduction in the latter. WT GFP-CMs: n = 18; MUT GFP-CMs: n = 18. (C) Voltage dependences: steady-state activation (WT GFP-CMs: n = 18; MUT GFP-CMs: n = 18)/inactivation curves (WT GFP-CMs: n= 18; MUT GFP-CMs: n = 16). All values are reported as mean ± SD. * p < 0.05, ** p < 0.005 (unpaired t-test). Data are relative to four independent cell differentiations. (D) Dot plot of peak sodium current densities, measured at −30 mV, in MUT GFP-CMs (56.53 ± 33.96 pA/pF) relative to WT GFP-CMs (171.73 ± 57.83 pA/pF). Average current density values are indicated in bold red. The blue arrow indicates the average INa density values, expressed as a percentage.

