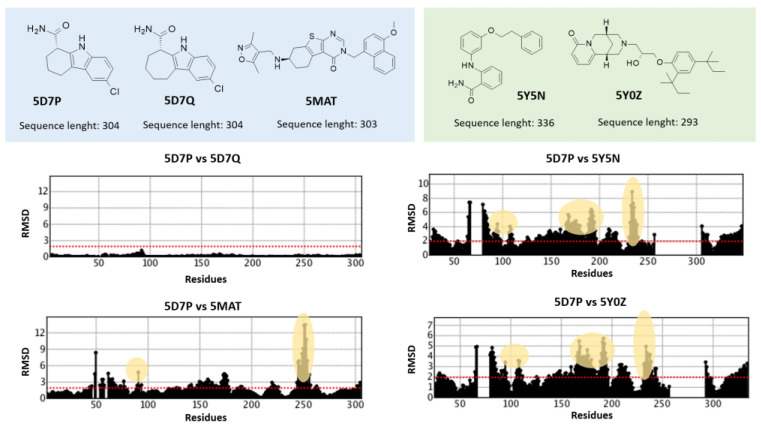
Figure 4.
Schematic representation of the role played by differences in the inhibitor chemotype and/or in the protein sequence length to affect the SIRT2 conformation. RMSD trends, as obtained by superimposition of 5D7P, 5D7Q, 5MAT, 5Y5N, and 5Y0Z, are shown; the chemical structure of the co-crystallized inhibitors is also reported. Similar and dissimilar chemo-types are highlighted in light cyan and green. Residues belonging to the inhibitor binding site are highlighted in yellow. Gap in sequence length is shown in the RMSD plot.

