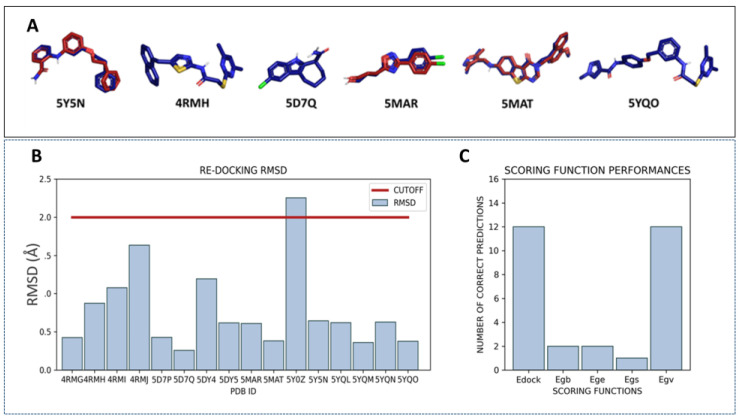
Figure 5.
(A) Superposition of the docking pose (red) obtained by the re-docking of the crystallographic ligand with the crystallographic ligand itself (blue). The best poses identified by both the Edock and Egv are reported. One candidate for each chemotype is represented. (B) Re-docking performances. The plot reports the RMSD (Å) of the docking pose with respect to the corresponding crystallographic coordinates. (C) Scoring function performances. For each scoring function (Edock, Egb, Ege, Egs, and Egv) the number of cases in which the SF can recognize the lowest RMSD docking pose is reported.

