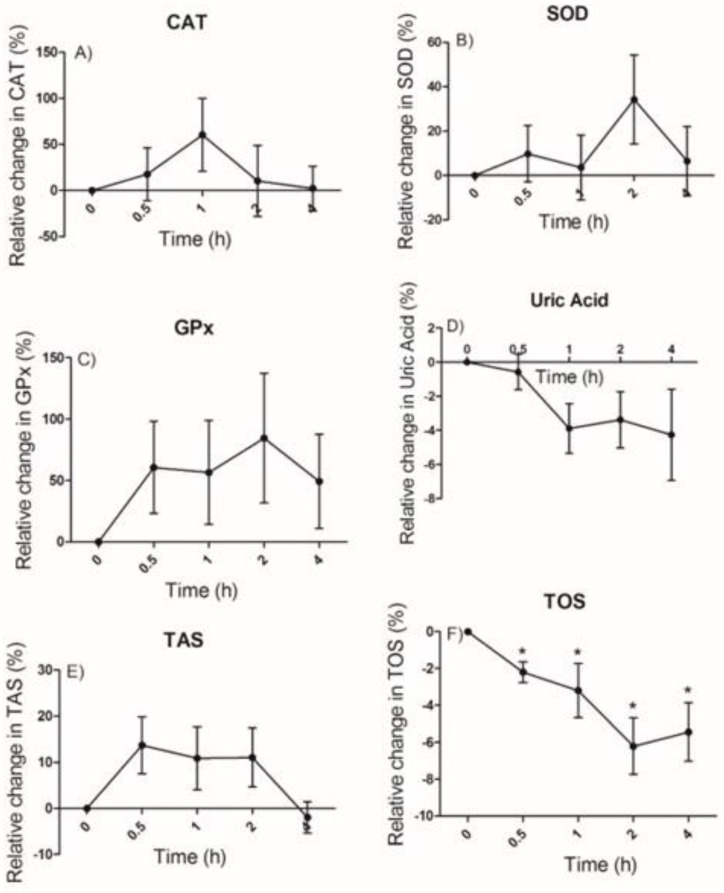
Figure 2.
Relative changes in the serum and erythrocyte antioxidant parameters catalase (CAT) (A), superoxide dismutase (SOD) (B), glutathione peroxidase (GPx) (C), uric acid (D), total antioxidant status (TAS) (E), total oxidant status (TOS) (F) after the juçara juice consumption. Data are expressed as the means and SEM. Note: * p-values < 0.05 compared to the baseline (n = 8–10); one-way ANOVA and Tukey’s test.

