Figure 6.
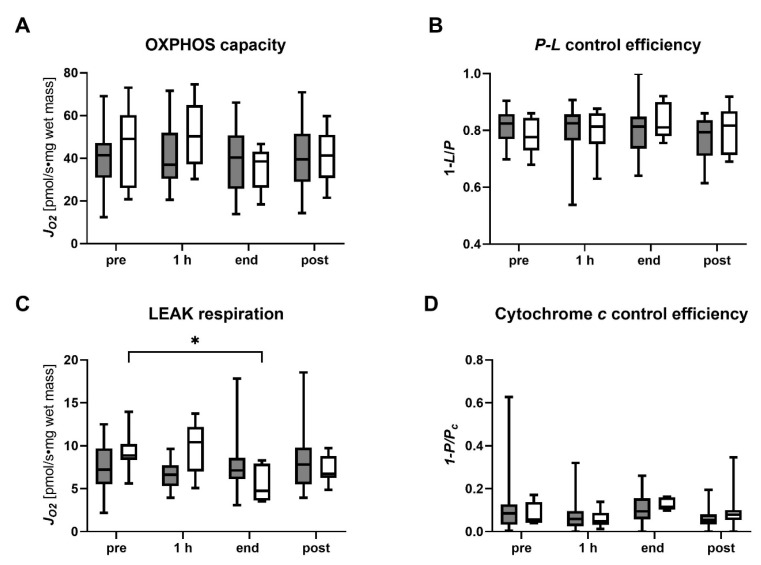
Analysis of succinate-linked mitochondrial respiration in tissue biopsies of transplanted DBD and DCD livers pre-NMP, at 1 h and at the end of NMP, and post-reperfusion. (A) OXPHOS capacity, (B) P-L control efficiency, (C) LEAK respiration and (D) cytochrome c control efficiency were measured and calculated following the protocol as described in Table S2. Values are represented as the median and interquartile range for DBD (grey) and DCD (white) livers. (* p < 0.05, ANOVA tests between time points and between the groups; details are described in the section on statistical analysis). NMP, normothermic machine perfusion; h, hour; DBD, donation after brain death; DCD, donation after circulatory death.

