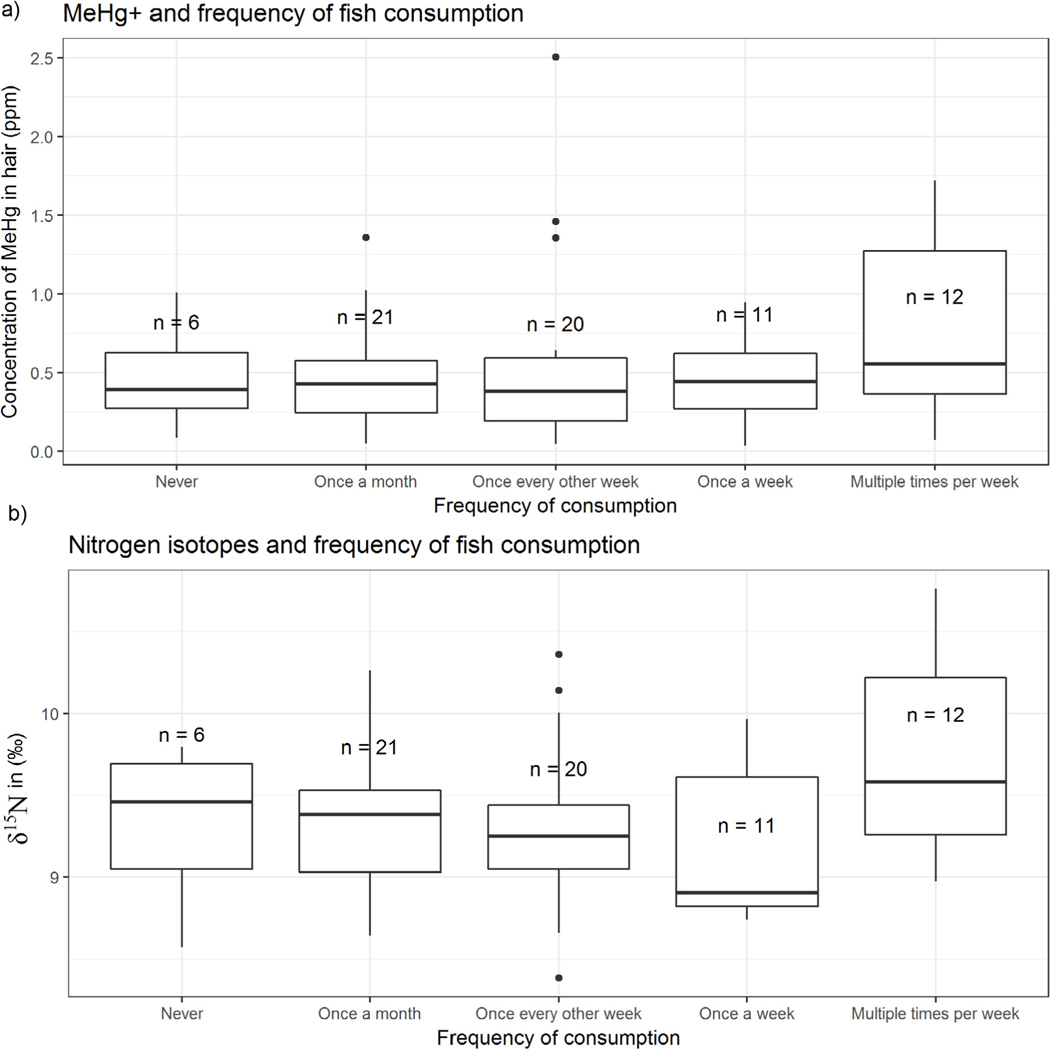
Fig. 3.
(a) Concentrations of MeHg+ in hair samples grouped by self-reported fish consumption, and (b) δ15N in hair based on self-reported consumption of fish. Boxplots represent first quartile, median, and third quartile while whiskers represent the highest and lowest datum within 1.5 interquartile range (IQR). Individual points are data outside 1.5*IQR. MeHg+ - monomethylmercury, δ15N - stable isotope ratio of N.

