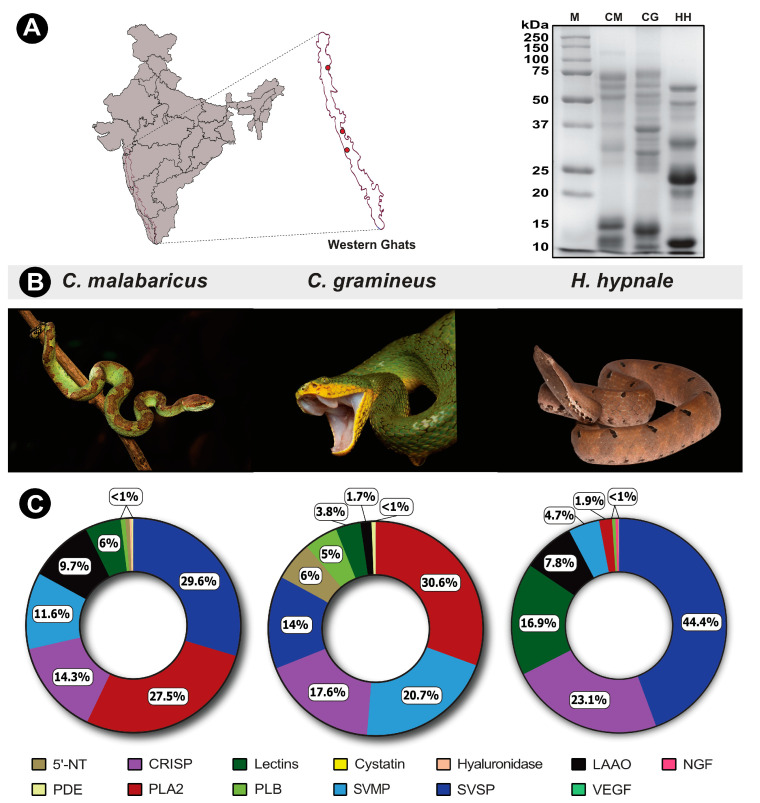
Figure 1.
Sampling locations of pit vipers from the Western Ghats, along with their representative photographs and SDS-PAGE and venom profiles. In this figure, panel (A) shows sampling locations and SDS-PAGE profiles of pit viper venoms; panel (B) shows representative photographs of pit vipers; and panel (C) represents the doughnut charts with the relative abundance of toxins in their venoms estimated via tandem mass spectrometry. Toxin families are individually colour coded, and the relative abundances are expressed as percentages. CM: C. malabaricus (Photo by Surya Narayanan); CG: C. gramineus (Photo by Kartik Sunagar) and HH: H. hypnale (Photo by Ajinkya Unawane).

