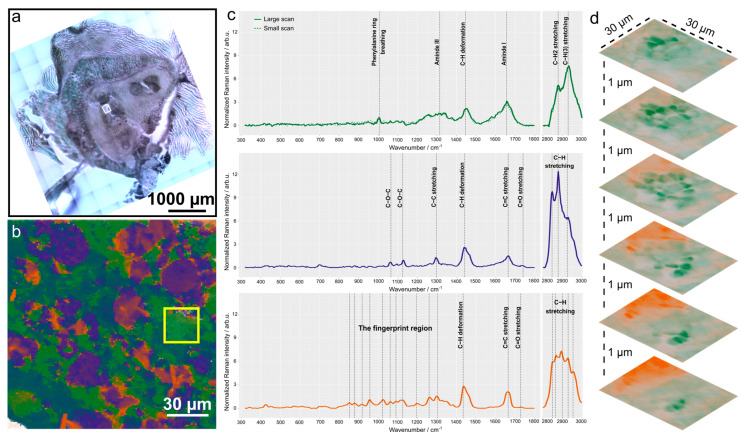
Figure 6.
Raman spectroscopic analysis of the lesion. (a) Bright field overview image of pelvis section LR1 used for Raman imaging. The small white square indicates the region subjected to Raman imaging. (b) False colour Raman image using N-FINDR analysis with intensity-normalised Raman data. (c) Endmember (EM) spectra, top row: EM 1, middle row: EM2, and bottom: EM 3. The EM1 of the small scan (dashed line) in also provided in the top row to show the similarities between the two. (d) High-resolution 6-layer 3D Raman scan performed in the region highlighted with a yellow square in panel (b).

