Figure 4.
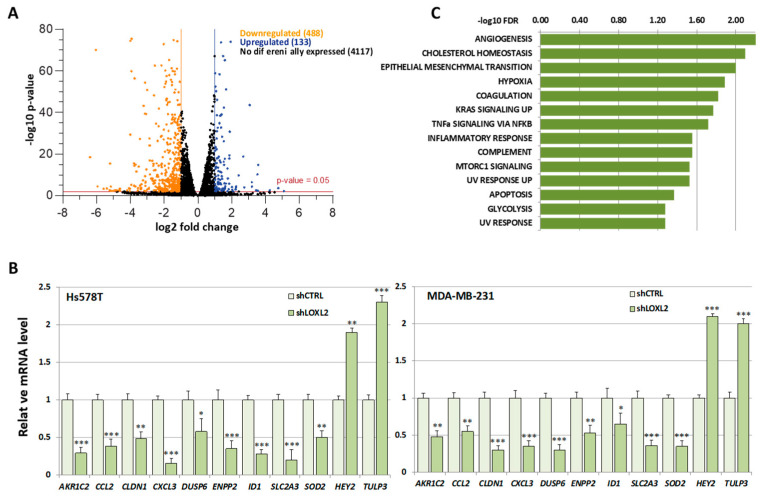
Gene expression profile of LOXL2-silenced cells: (A) Volcano plot showing transcriptome changes in LOXL2-depleted cells. The cutoffs were established at the log2 fold change > 1.0 or <−1.0 and the p-value < 0.05. Orange and blue dots represent significantly downregulated and upregulated genes, respectively. (B) Quantitative RT-qPCR confirming regulation of selected genes in LOXL2-ablated cells (dark green) compared to LOXL2 control cells (light green). Data are the mean ± SEM of three independent experiments assayed in triplicated samples in two independent breast cancer cell lines. The p-value was calculated by two-sided unpaired Student’s t-test. (C) GSEA plot of differentially expressed genes (DEGs) showing enrichment of hallmark signatures. FDR values (−log10 FDR) of such enrichments are shown on the x-axis. (* p < 0.05, ** p < 0.01, *** p < 0.001).

