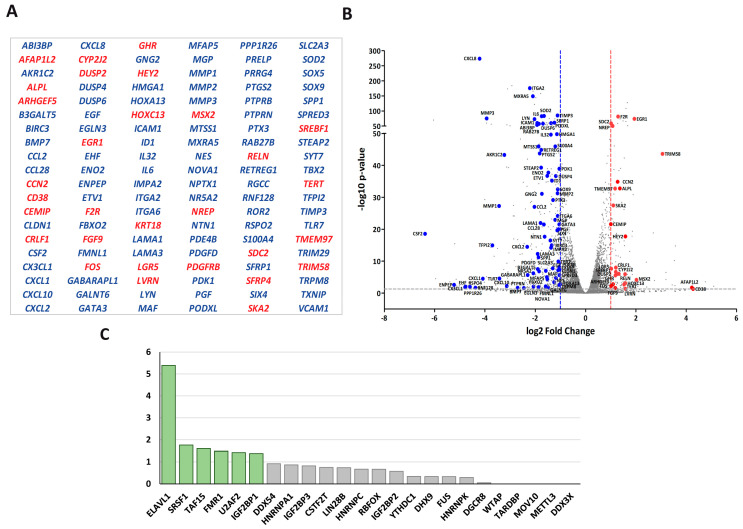
Figure 5.
RBP candidates to be regulated by LOXL2: (A) List of differentially expressed genes in LOXL2-silenced cells with a described role in EMT. Up- and downregulated genes are marked in red and blue, respectively. (B) Volcano plot showing LOXL2-regulated EMT-related genes. The cutoffs were established at the log2 fold change > 1.0 (red line) or <−1.0 (blue line) and the p-value < 0.05 (grey line). Red and blue dots denote up- and downregulated EMT-related genes, respectively. (C) Enrichment plot of RBPs’ targets in the EMT-related signature relative to the non-EMT-related signature. The p-values were obtained by using Fisher’s exact test to compare the number of targets in both groups of genes. A p-value < 0.05 was considered statistically significant. Boxes marked in green represent significantly enriched RBPs.

